
Tutorial: WaPLUGIN User Interface
समापन की आवश्यकताएँ
5. Indicators Calculator Tab
In this chapter we'll explore the Indicators Calculator tab of the WaPLUGIN. With this feature you can calculate irrigation performance indicators.
1. Open the Indicators Calculator tab in the WaPLUGIN.

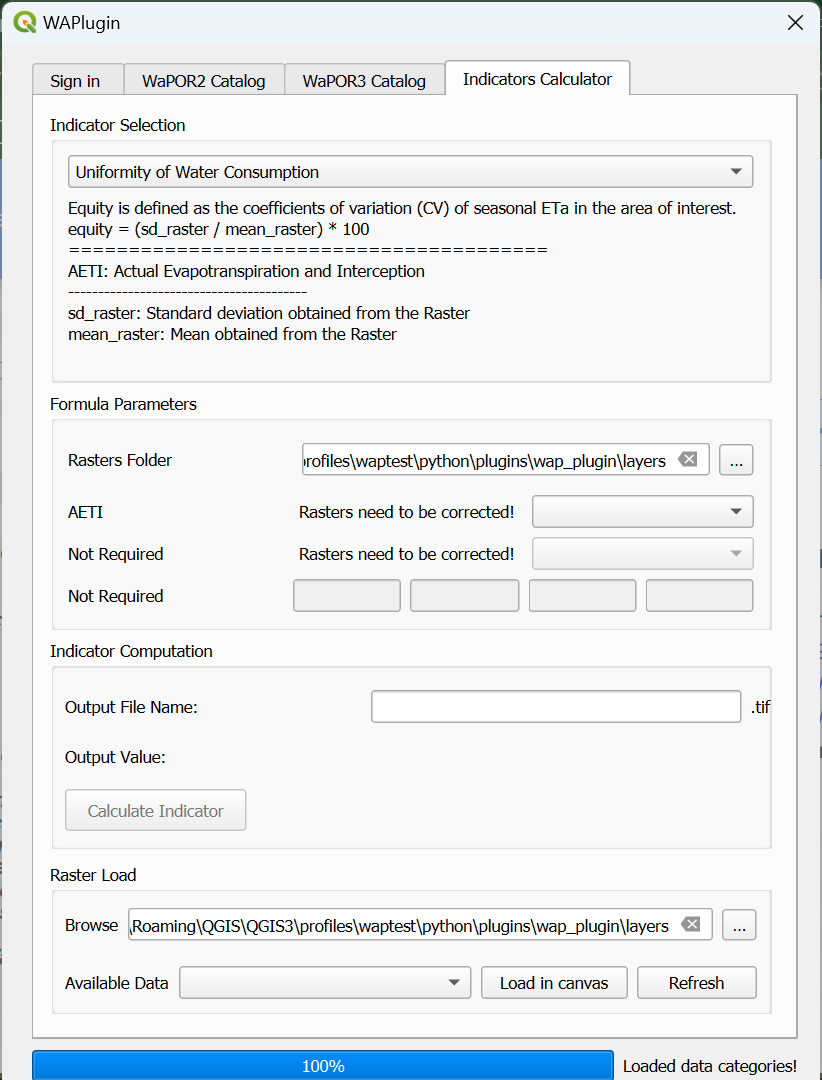
2. Select the desired irrigation performance indicator from the dropdown menu under Indicator Selection.
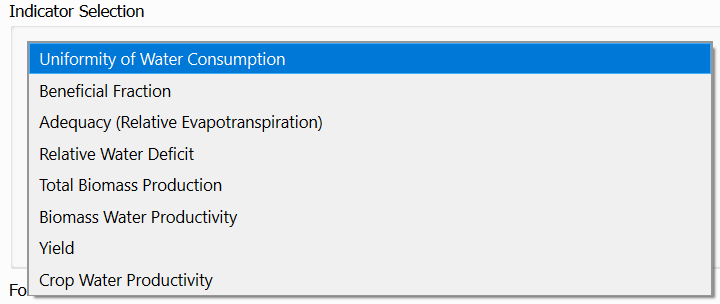
There are currently 8 available indicators:

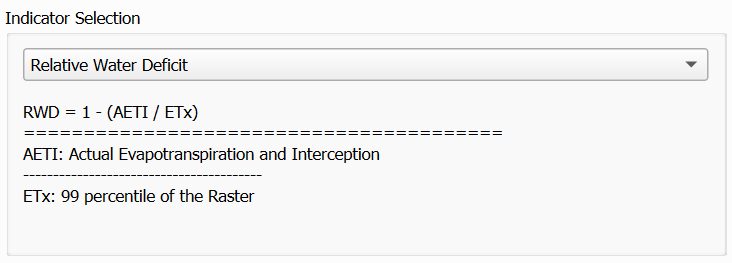
After selecting an indicator, details about the equation and datasets required for that specific indicator will be displayed.

After computation, the output raster can be loaded into the QGIS map canvas for further analysis.
9. Use the Raster Load Section in the Indicators Calculator tab to load the indicator rasters into QGIS. Simply select the computed indicator and click Load in Canvas.
Using External Rasters
If you want to load a raster from another source (not downloaded via the plugin) and use it as an input parameter to compute the indicators, please ensure the raster file follows the naming structure:
1. Open the Indicators Calculator tab in the WaPLUGIN.
2. Select the desired irrigation performance indicator from the dropdown menu under Indicator Selection.
There are currently 8 available indicators:
- Uniformity of Water Consumption
- Beneficial Fraction
- Adequacy
- Relative Water Deficit
- Total Biomass Production
- Biomass Water Productivity
- Yield
- Crop Water Productivity
After selecting an indicator, details about the equation and datasets required for that specific indicator will be displayed.
- The required rasters should be placed in the same folder. This folder is automatically set to the layers folder created by WaPLUGIN when data was downloaded.
- These fields are automatically populated based on the needed raster types.
- Conversion factors are only required for data downloaded from the WaPOR2 Catalogue. You can retrieve these factors by clicking the Details button next to the Raster Type in the WaPOR2 Catalog tab.
- For WaPOR3 Catalogue data, no manual correction is needed as the data is automatically corrected during download.
- For example, users may need prior knowledge about the irrigation schemes or crop types in the study area.
- This raster file will be saved in the same folder as the input rasters once the Calculate Indicator button is clicked.
After computation, the output raster can be loaded into the QGIS map canvas for further analysis.
9. Use the Raster Load Section in the Indicators Calculator tab to load the indicator rasters into QGIS. Simply select the computed indicator and click Load in Canvas.
Using External Rasters
If you want to load a raster from another source (not downloaded via the plugin) and use it as an input parameter to compute the indicators, please ensure the raster file follows the naming structure:
[Name] [level] [place] [raster type] [time filter].tifThis naming convention allows WaPLUGIN to detect and use the raster for computations.