
Tutorial: Irrigation Performance Indicators and Water Productivity
3. Accessing WaPOR V3 Data
Now we have loaded the study area polygon in the QGIS map canvas, we can proceed with downloading WaPOR data with the WaPLUGIN.
1. Open the WaPLUGIN dialog from the main menu (Plugins | WAPlugin | Water Accounting and Productivity Plugin) or by using the  icon in the toolbar.
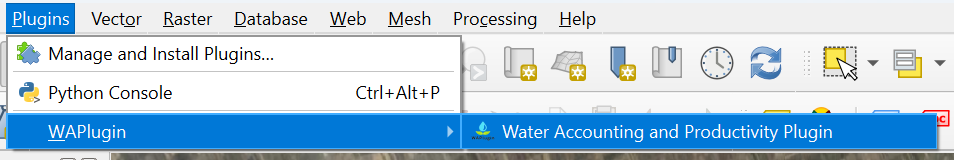
2. Go to the WaPOR3 Catalog tab.
3. In the Workspace dropdown, select WAPOR-3.
For this tutorial, you will need to download the following three datasets:
- Actual Evapotranspiration and Interception (AETI)
- Transpiration (T)
- Net Primary Production (NPP)
Since the Oued Hellal region has Level 3 data available at 20m resolution, select Level 3 (20m) for the highest resolution and we'll use Dekadal data.
Most agricultural plots have a start and end season that varies by region and crop. For this tutorial use:
- Start of season: 01 October 2022
- End of season: 30 April 2023
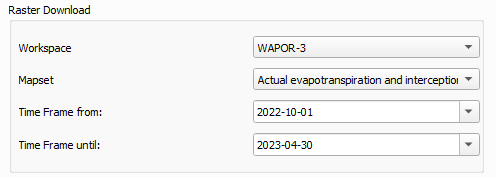
4. In the Mapset dropdown, select Actual Evapotranspiration and Interception (dekadal - 20m).
5. Set the time frame for the season:
- Time Frame From: 01 October 2022
- Time Frame Until: 30 April 2023
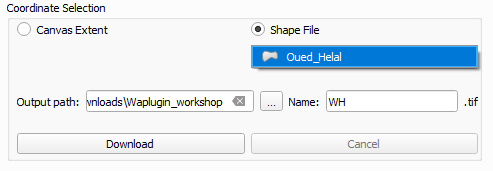
6. In the Coordinate Selection section, choose Shape File.
- From the dropdown, select the vector file corresponding to your study area (Oued_Hellal).
7. Change the output path to a new folder on your computer (e.g., Waplugin_workshop).
8. Add a prefix to the layer name for organization (e.g., “WH” for Oued Helal).
9. Click on Download and wait for the progress bar to complete.
- Since the study area is small, the download time should be short.
- Note: The larger the study area or higher the resolution (L3), the longer the download will take.
9. To verify the download, go to the Raster Load Section.
10. Change the Raster Load path to the Waplugin_workshop folder you created earlier.
11. Click Refresh, and all downloaded layers should appear in the dropdown menu at Available Data.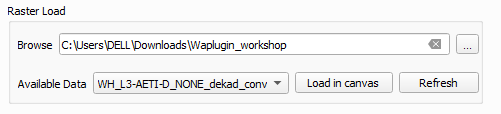
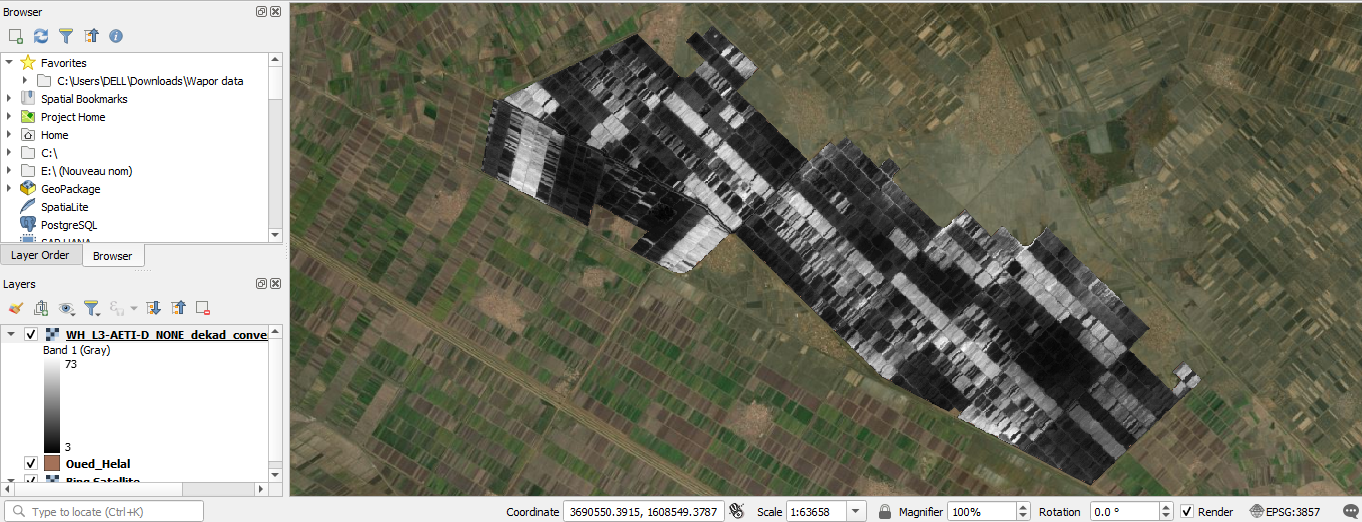
12. To visualize one of the downloaded layers, select it from the dropdown and click Load in Canvas.
- The raster layer will now display in your project canvas.
13. Repeat the same procedure for downloading the Transpiration and Net Primary Production (NPP) rasters:
- Go back to the WaPOR V3 Catalogue tab and select Transpiration (dekadal - 20m) and Net Primary Production (dekadal - 20m) from the Mapset dropdown.
- Use the same time frame, coordinate selection (using the Oued-Helal shapefile), and output path (Waplugin_workshop).
Now we've downloaded all necessary data, we'll aggregate it to seasonal data.