
Tutorial: Irrigation Performance Indicators and Water Productivity
Aggregazione dei criteri
4. Aggregating Dekadal Rasters to Create Seasonal Maps
Seasonal maps are created by summing the dekadal data over the entire season. This feature is currently being developed to be included in the plugin. For this tutorial, we will use the r.series tool available in the QGIS toolbox.
1. Close the plugin dialog and click in the Toolbar to open the Processing Toolbox panel.
2. In the search bar of the toolbox, type r.series to find the tool.
3. Double-click on r.series to open the tool dialog, which allows for the aggregation of multiple rasters.
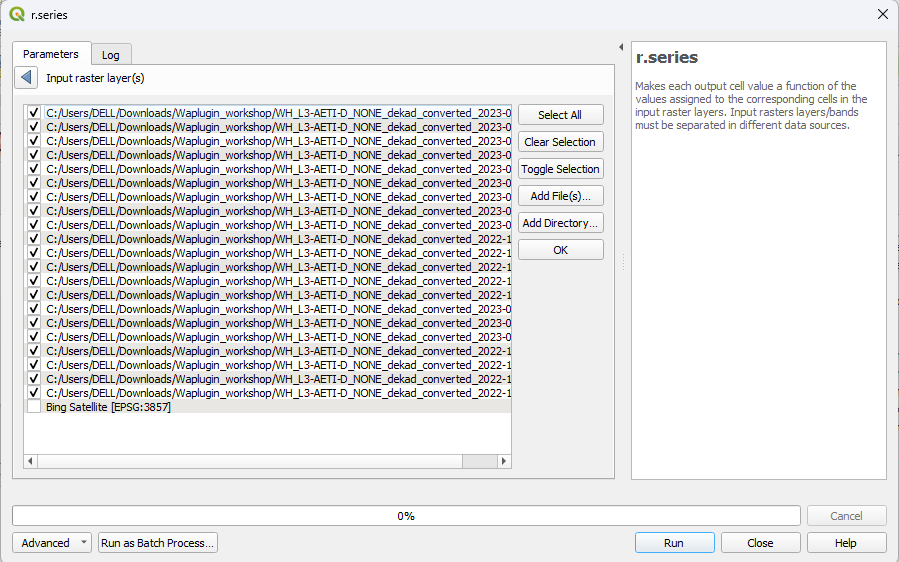
4. At the Input raster layer(s) field, click
 .
.5. Click the Add Files button.
6. Browse to the Waplugin_workshop folder where you stored the downloaded rasters.
7. Select all 21 AETI rasters (one for each dekadal period in the season) and click on Import.
 to go back.
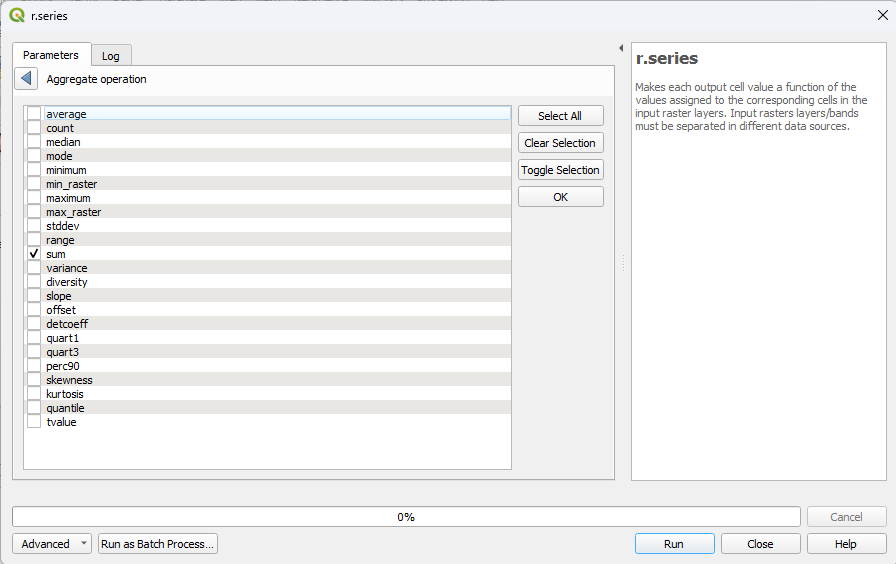
9. In the Aggregate Operation section, the default option is set to average. Uncheck the average option and check the sum option instead.
- This will sum all the dekadal
AETI rasters to create a seasonal map.
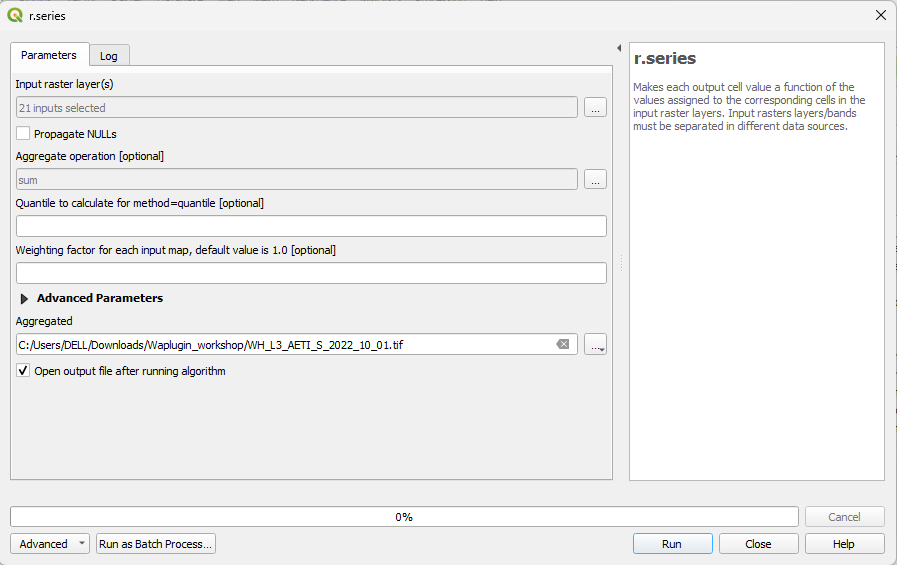
11. Click on Run to start the aggregation process.
13. Repeat the same steps for the Transpiration (T) and Net Primary Production (NPP) rasters:
- For Transpiration, select all
the 21 T rasters, aggregate them using the sum option, and
save the output as WH_L3_T_S_2022_10_01.
- For Net Primary Production,
select all the 21 NPP rasters, aggregate them using the sum
option, and save the output as WH_L3_NPP_S_2022_10_01.
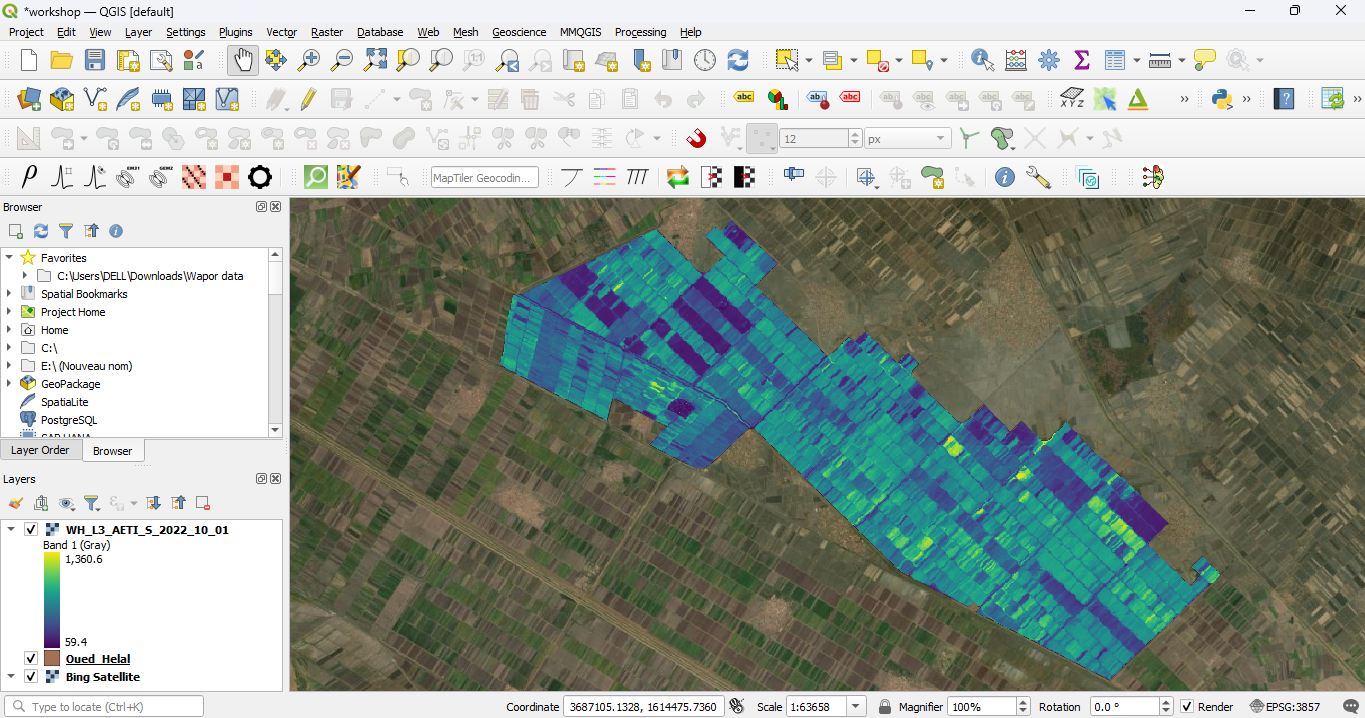
Final Output
- After completing these steps, you will have three seasonal maps:
- AETI (Actual Evapotranspiration and Interception)
- T (Transpiration)
- NPP (Net Primary Production)
- These maps will be used in the next chapter for indicator calculation.