メインコンテンツへスキップする
OCWGIS
Enhancing Water Productivity with WaPOR: A Hands-On Workshop Using WaPLUGIN in QGIS
0%
Previous
Tutorial: Irrigation Performance Indicators and Water Productivity
Introduction
Introduction to FAO WaPOR
Tutorial: Introduction to FAO WaPOR data
Introduction to the WaPLUGIN
Tutorial: How to install WaPLUGIN
Tutorial: WaPLUGIN User Interface
Irrigation performance and Water productivity using WaPLUGIN
Tutorial: Irrigation Performance Indicators and Water Productivity
Congratulations. You have completed this workshop.
Share your results!
Workshop Assessment Questionnaire
Next
OCWGIS
サイドパネル
[[coursecategories]]
All categories
Courses in English
Cours en français
Cursos en español
Courses in Japanese
Curso em Português-BR
Cursussen in het Nederlands
Home
日本語 (ja)
English (en)
Español - Internacional (es)
Français (fr)
Italiano (it)
Nederlands (nl)
Português - Portugal (pt)
العربية (ar)
فارسی (fa)
हिंदी (hi)
日本語 (ja)
简体中文 (zh_cn)
あなたは現在ゲストアクセスを利用しています
ログイン
OCWGIS
[[coursecategories]]
折りたたむ
展開する
All categories
Courses in English
Cours en français
Cursos en español
Courses in Japanese
Curso em Português-BR
Cursussen in het Nederlands
Home
OCWGIS
Course Menu
OCWGIS
コースインデックスを開く
ブロックドロワを開く
QGIS_WaPlugin
Irrigation performance and Water productivity using WaPLUGIN
Tutorial: Irrigation Performance Indicators and Water Productivity
ブック
ブックを印刷する
この章を印刷する
前
次
5. Compute Indicators Using Indicators Calculator Tab
5.7. Yield
We'll calculate now the Yield.
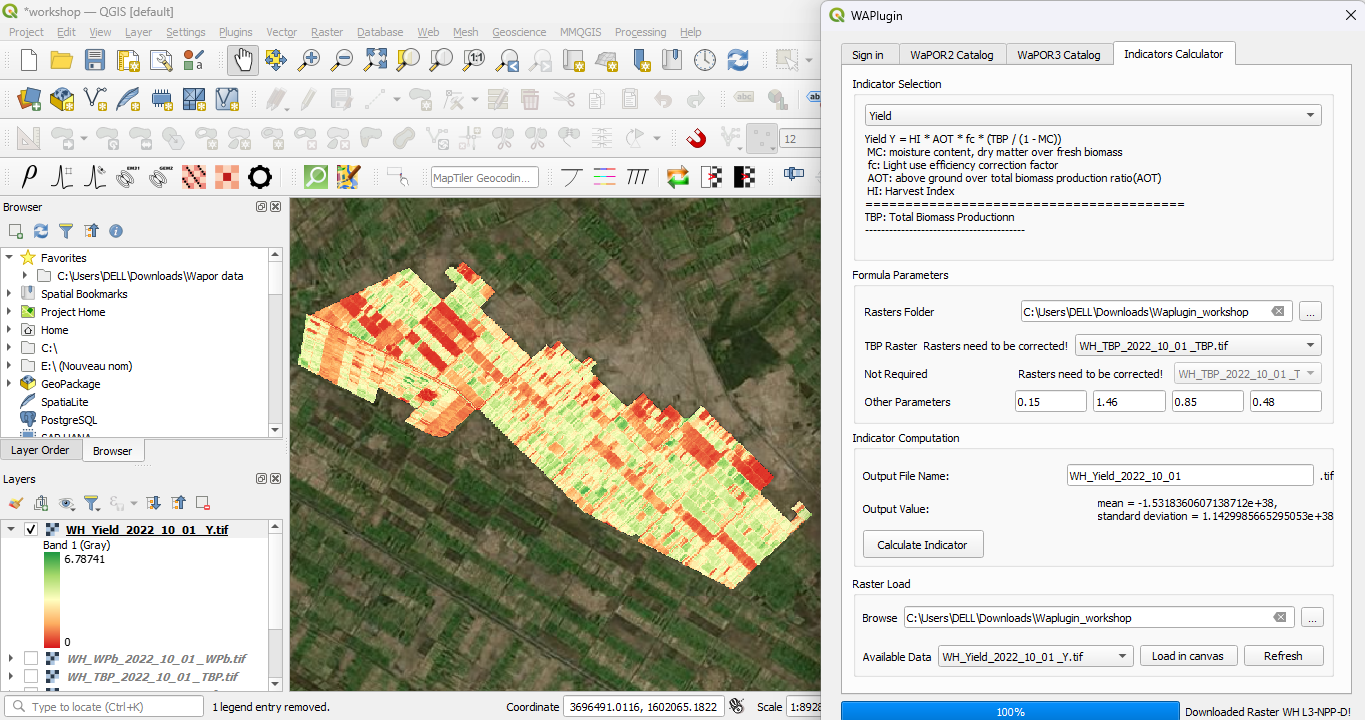
1.
In the
Indicator Selection
dropdown, select
Yield
.
Formula
:
Y = HI * AOT * fc * (TBP / (1 - MC))
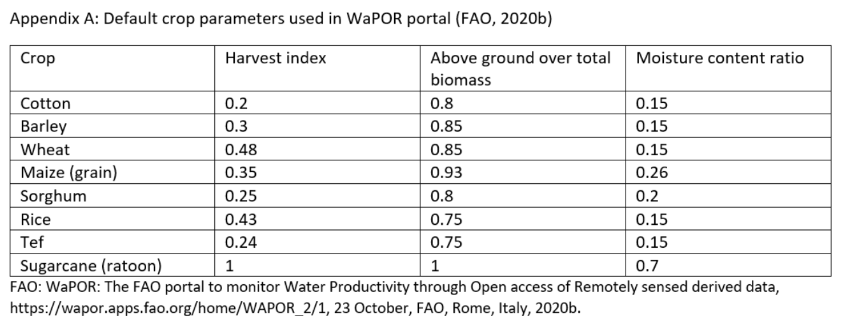
Parameters for Oued Hellal:
MC
: 0.15 (Moisture content, dry matter over fresh biomass)
fc
: 1.46 (Light use efficiency correction factor)
AOT
: 0.85 (Above ground over total biomass production ratio)
HI
: 0.48 (Harvest Index)
Note: These parameters are specific to the type of crops that are grown in the study area.
2.
In the
Formula Parameters
, select the
Total Biomass Production raster
(
WH_TBP_2022_10_01
).
3.
Enter the above parameters and name the output file
WH_Yield_2022_10_01
.
4.
Click
Calculate Indicator
. The output raster will be saved and loaded into QGIS.
前
次
Prev Section
移動 ...
移動 ...
Tutorial: Introduction to FAO WaPOR data
Tutorial: How to install WaPLUGIN
Tutorial: WaPLUGIN User Interface
Share your results!
Workshop Assessment Questionnaire
Next Section