تخطى إلى المحتوى الرئيسي
OCWGIS
Enhancing Water Productivity with WaPOR: A Hands-On Workshop Using WaPLUGIN in QGIS
0%
Previous
Share your results!
Introduction
Introduction to FAO WaPOR
Tutorial: Introduction to FAO WaPOR data
Introduction to the WaPLUGIN
Tutorial: How to install WaPLUGIN
Tutorial: WaPLUGIN User Interface
Irrigation performance and Water productivity using WaPLUGIN
Tutorial: Irrigation Performance Indicators and Water Productivity
Congratulations. You have completed this workshop.
Share your results!
Workshop Assessment Questionnaire
Next
OCWGIS
واجهة جانبية
[[coursecategories]]
All categories
Courses in English
Cours en français
Cursos en español
Courses in Japanese
Curso em Português-BR
Cursussen in het Nederlands
الصفحة الرئيسية
العربية (ar)
English (en)
Español - Internacional (es)
Français (fr)
Italiano (it)
Nederlands (nl)
Português - Portugal (pt)
العربية (ar)
فارسی (fa)
हिंदी (hi)
日本語 (ja)
简体中文 (zh_cn)
أنت الآن تدخل بصفة ضيف
تسجيل الدخول
OCWGIS
[[coursecategories]]
طي
توسيع
All categories
Courses in English
Cours en français
Cursos en español
Courses in Japanese
Curso em Português-BR
Cursussen in het Nederlands
الصفحة الرئيسية
OCWGIS
Course Menu
OCWGIS
فتح فهرس المقرر
فتح دُرج الكتلة
QGIS_WaPlugin
Congratulations. You have completed this workshop.
Share your results!
Share your results!
كتاب
اطبع الكتاب
اطبع هذا الفصل
fffff
السابق
التالي
1. Show us your maps
1.1. Organize the Layers in QGIS
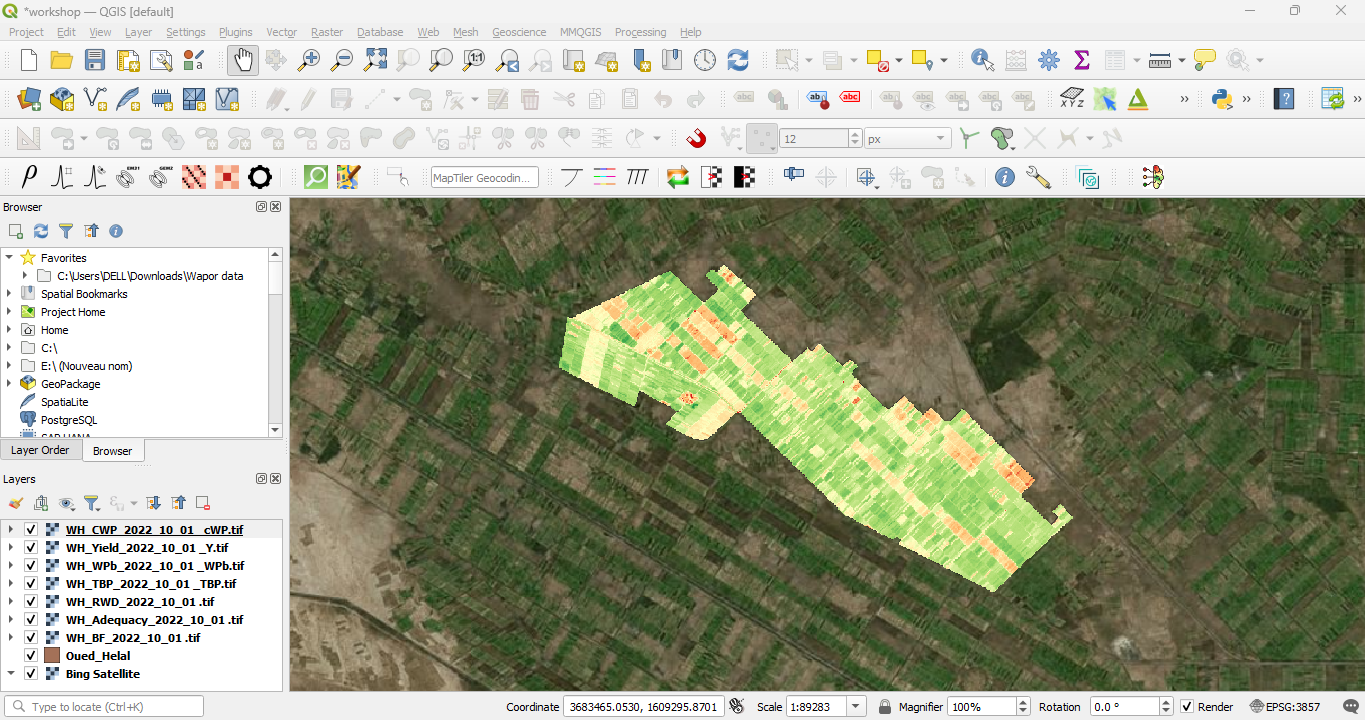
Let's first organise the layers in the project.
1. Make sure all the
computed indicator layers
(Beneficial Fraction, Adequacy, Relative Water Deficit, Total Biomass Production, Biomass Water Productivity, Yield, Crop Water Productivity) are loaded into your QGIS project.
السابق
التالي
Prev Section
الانتقال إلى...
الانتقال إلى...
Tutorial: Introduction to FAO WaPOR data
Tutorial: How to install WaPLUGIN
Tutorial: WaPLUGIN User Interface
Tutorial: Irrigation Performance Indicators and Water Productivity
Workshop Assessment Questionnaire
Next Activity