Share your results!
完了要件
fffff
1. Show us your maps
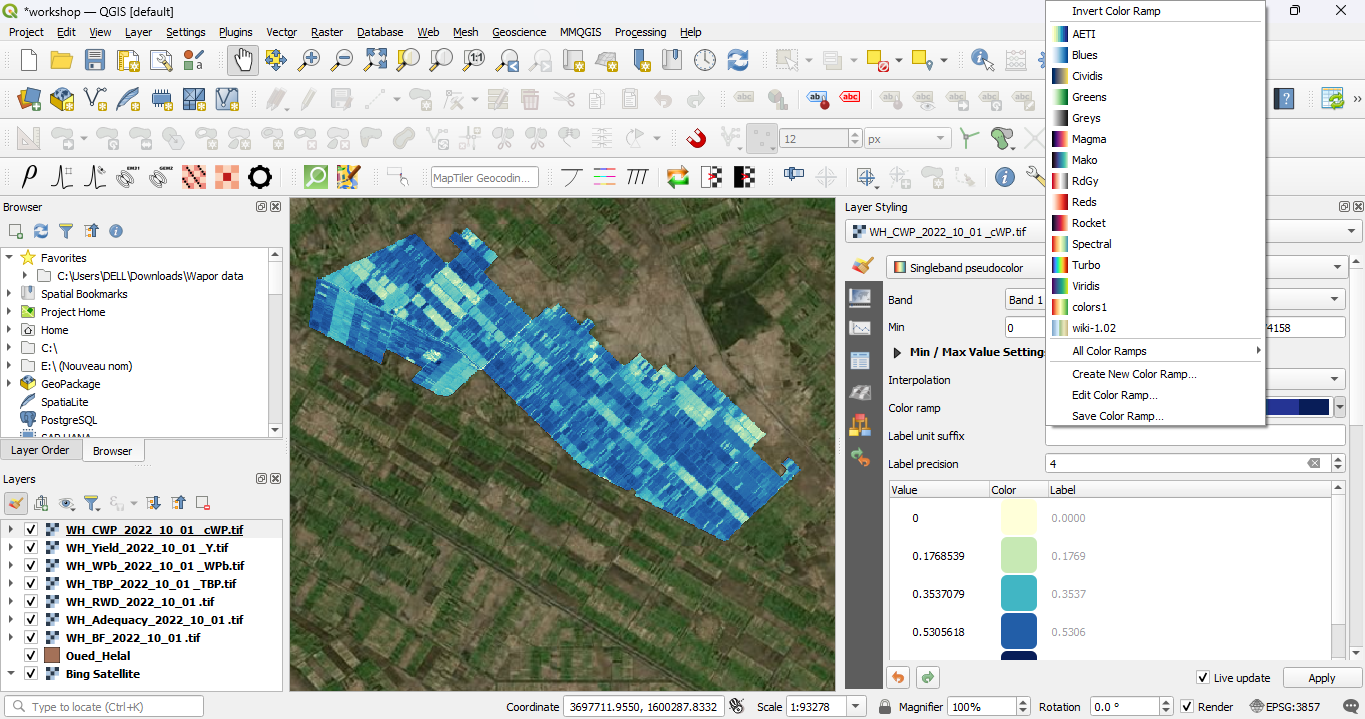
1.2. Change the Color Ramp for Each Indicator Layer
Let's make the colour ramps representative for the indicators.
1. Select a layer (e.g., Adequacy) in the Layers panel and click to open the Layer Styling panel.
2. Change the renderer from Singleband gray to Singleband pseudocolor to visualize the data with a color ramp.
3. Click on the Color Ramp dropdown to choose a suitable colour ramp for each indicator.
1. Select a layer (e.g., Adequacy) in the Layers panel and click
to open the Layer Styling panel.2. Change the renderer from Singleband gray to Singleband pseudocolor to visualize the data with a color ramp.
3. Click on the Color Ramp dropdown to choose a suitable colour ramp for each indicator.