Fire Risk Map
Learn how to create a Fire Risk Map using QGIS and remote rensing.
1. Introduction
1.1. Project Goals
The first step to take when starting a project like this, is to research the important factors that contribute to the problem at hand. When you know what these factors are, you can start looking for data that’s available. In the case of forest fire mapping, you need to research what factors in an environment cause a fire to be more likely to occur. Research has shown that a lot of different factors can influence fire susceptibility, but for the sake of keeping the module approachable, the most important factors have been chosen. These being: the Normalised Difference Moisture Index (NDMI), Land Cover, Slope, distance to roads, and distance to buildings. Factors like weather (windspeed, temperature, rain, etc.) are also important factors, but they can be hard to implement in this map, because we will be making a map that captures a single moment, and these factors can be vastly different from time to time. In the next few paragraphs, a short explanation will be given as to why each factor was chosen for this module. You can read it if you find it of interest, but it is not essential for the module, so you can proceed to the next step if you want.
NDMI
NDMI stands for Normalised Difference Moisture Index and is used to show heat stress in vegetation. Heat stress occurs when vegetation has a low water content. This low water content can be calculated from infrared imaging taken from satellites in space. Further in the module, the process of calculating this will be shown. The reason NDMI is so important for this module is because fire needs fuel to be able to burn. Dried out vegetation provides this fuel. The Index from NDMI ranges from -1 to 1, with -1 being barren land containing next to no moisture and 1 being lively land with no heat stress. The closer the NDMI on your map is to -1, the more likely fire is to occur, meaning higher risk.
Slope
Another factor that should be taken into consideration when creating a forest fire susceptibility map, is the slope of the research area. The topography of an area can give hints as to why fire is more likely to occur in a place. Research has shown that areas with a steeper slope, fires are more likely to occur. This has to do with the area being dryer in steep slopes due to rainwater runoff. The steeper the slope, the less time the vegetation and soil have to retain the water, causing these areas to be dryer. Fire is also able to move quicker uphill due to the pre-heating of vegetation on a slope. When a slope is steeper, heat radiation from the fire gets absorbed by the vegetation and soil above the fire, and combustion will happen quicker. For both these factors, the rule is: the steeper the slope, the more susceptible the area is to fires.
Land Cover
The type of land use in an area is maybe the most important factor. It is after all, extremely difficult to start a fire in a river. The land cover map shows what type of vegetation can be found in an area, as well as how the land is used. Possible land cover types can be rivers, croplands, grasslands, forests, shrublands, etc. This matters, because not all land cover types are as susceptible to fire. For example, shrublands tend to be drier, and thus are of a higher fire risk than forests, which often contain more biodiversity with a higher ignition point. It can also be used to filter out areas which are less susceptible to fire like rivers. Research needs to be done on what types of land cover provides the most useful fuel for fires. This research can be done more effectively when you know exactly what type of vegetation grows in an area, this is however not known data for this project. This is why an approximation is made for what land cover type is most at risk, based on research and other studies regarding this topic. The result of this research shows that land cover types most at risk are shrublands, followed by tree covered areas (forests), after that, cropland, and after that, grasslands. The combination of the NDMI and land cover, gives us a good idea of what areas are most susceptible to fire.
Distance to Roads and Distance to Buildings
Lastly, 80-85% of all forest fires worldwide are the cause of human intervention. Either by accident or on purpose. In Indonesia and in a lot of other countries, it is commonplace to set plots of land on fire to create more farmland. This is done because it’s an easy, cheap solution to accommodate the increasing demand for products like palm oil. Fires can also be started on accident because of human errors, like campfires, thrown out cigarettes, or car accidents. This is why it is important to take human settlements into account when creating a forest fire susceptibility map. The closer an area is to human activities like roads, cities or farmlands, the more at risk the area is for fires to occur.
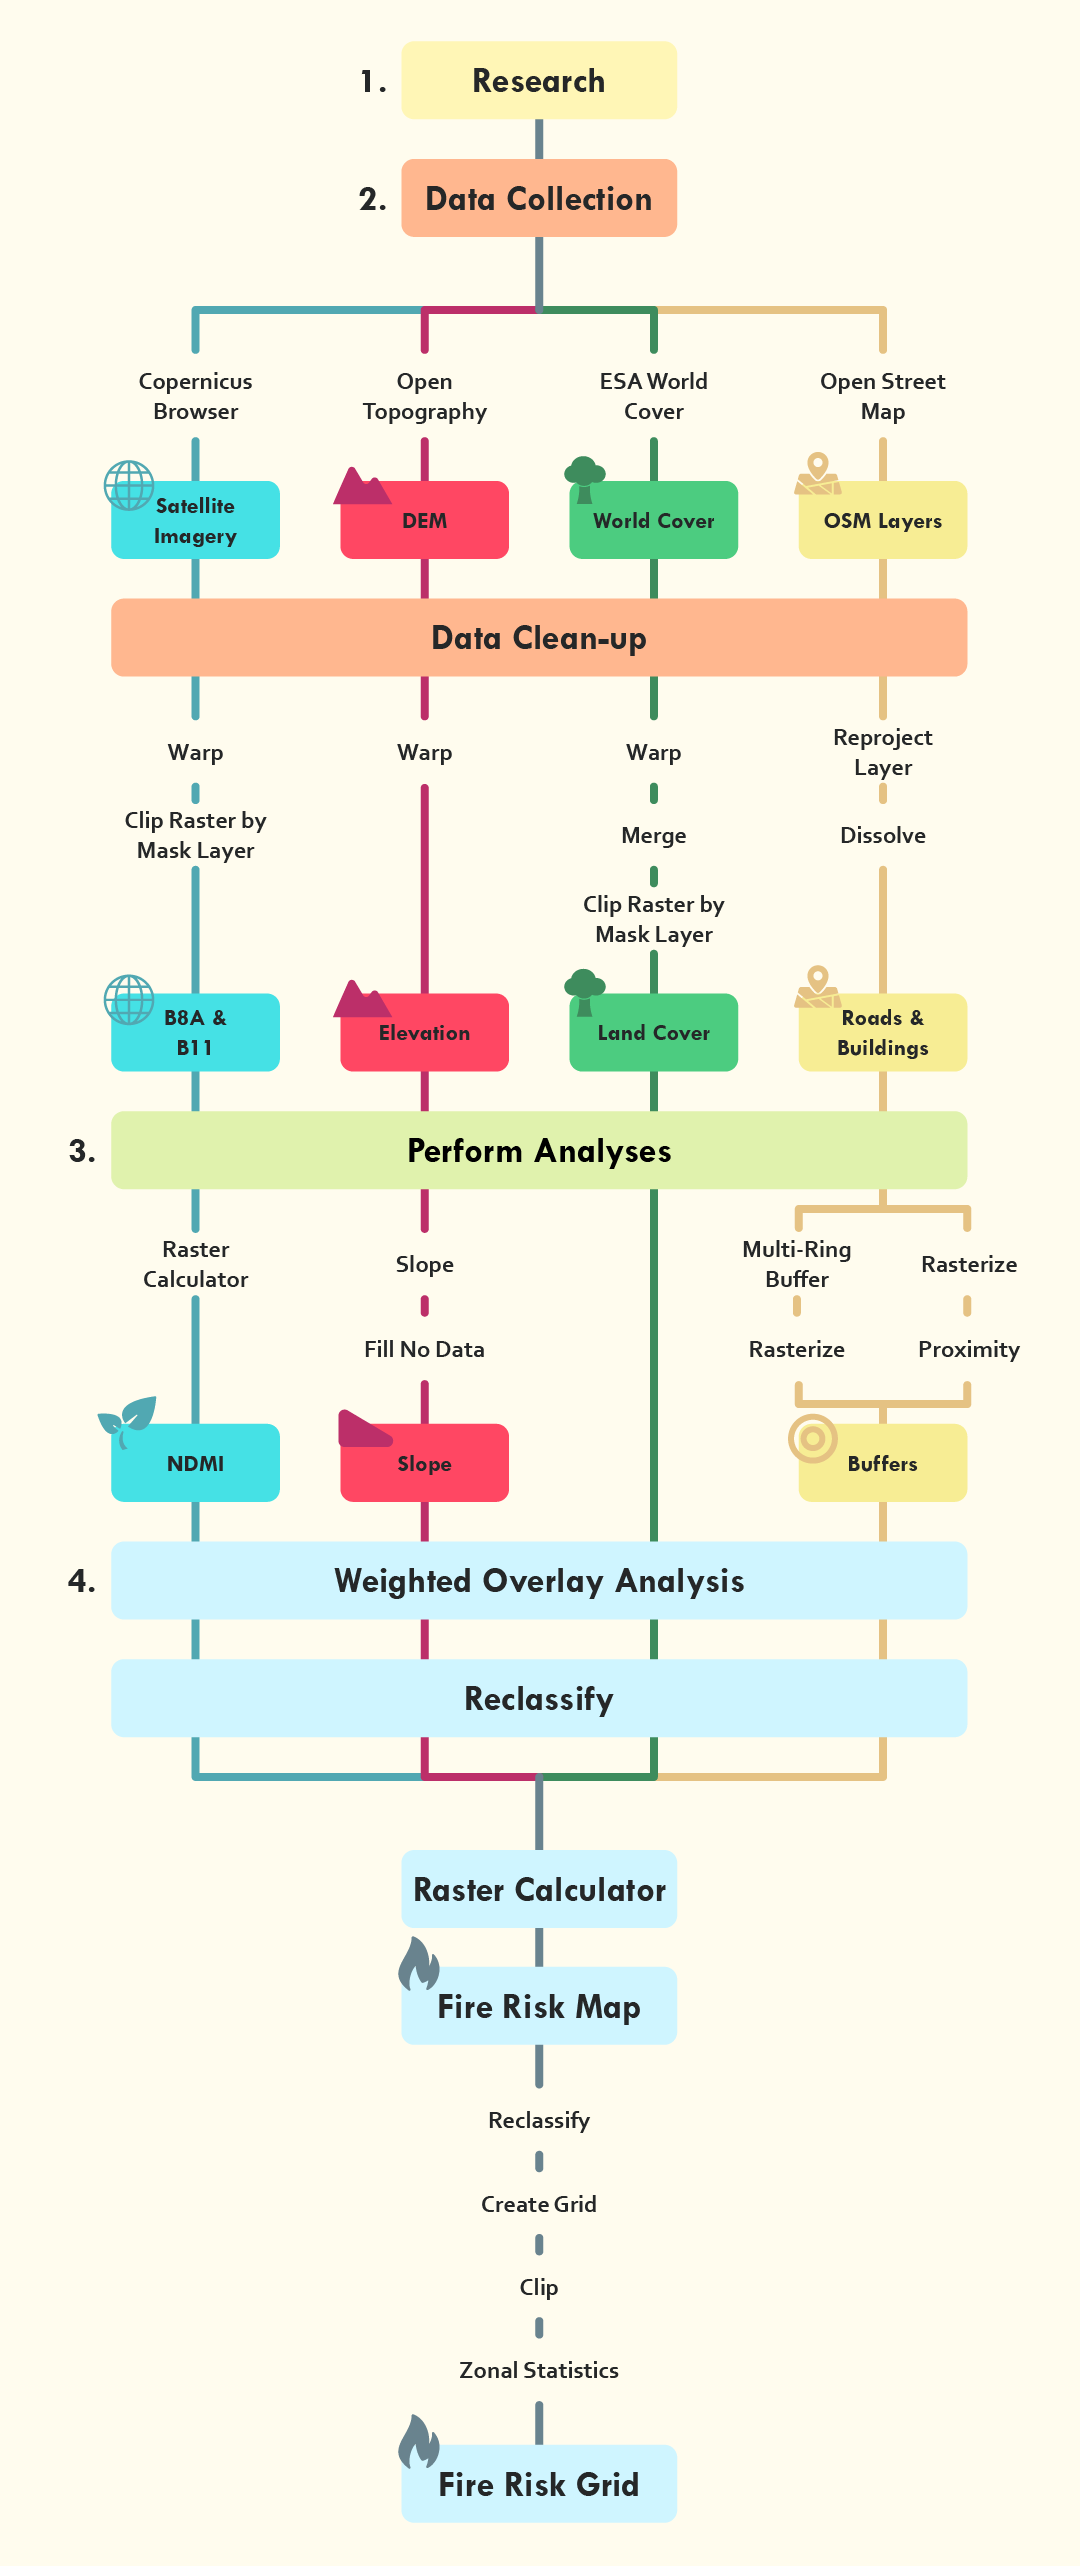
Flowchart
Below you see the flowchart of the analysis you will perform during this module. It lays out every step with all the tools and data that will be used. You don't need to remember the steps, as the module explains everything you need to know, but it can be helpful for the future if you need a quick reference.