
Fire Risk Map
Learn how to create a Fire Risk Map using QGIS and remote rensing.
2. Data and Preparation
2.5. Roads and Buildings
Human activity is always a factor in locations where fires may start. This is why we need to add some extra data to our analysis. You might have noticed that the Land Cover map already has a value for urban areas, but it’s quite difficult to extract and not as precise as we want it. With OpenStreetMap, we can download specific features and edit them to our needs.
Vector layers are shapes that are infinitely sharp and can store data. Unlike rasters, like the satellite imagery, they aren’t made from pixels. If you zoom in on a vector layer, it will always stay sharp. You can create vector areas or objects as features, and they are very useful to visualise a map and quickly analyse whatever you want. A single feature can store a lot of data, which makes them very versatile and easy to edit. We already made a vector layer ourselves for the study area, which is a polygon. Polygons are shapes with at least 3 sides, often used for large objects like buildings, or large areas like cities or countries. You’ll also come across other feature types, like points and lines. Points often represent locations or objects on a map, like trees. Lines will often represent things like waterways or roads. In this chapter, we will make use of lines and polygons.
Downloading Roads and Buildings with QuickOSM
Before we start, if you turn off all your layers in the project, you'll see the OpenStreetMap base map. On this base map, the grey and orange lines represent the roads. However, we can't use the base map directly to work with the road data because it's just a visual reference. To actually use the roads in our analysis, we need to extract them from OpenStreetMap using a plug-in. You downloaded the QuickOSM plug-in in chapter 1.5 Plug-Ins.
With Quick OSM, you can extract data directly from OpenStreetMap, including roads and building data.
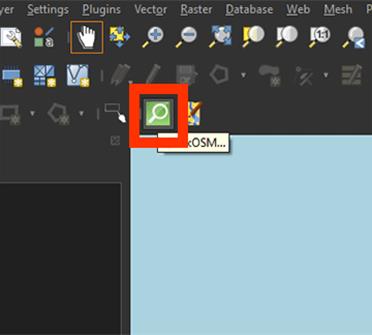
1. Click on the green QuickOSM icon.
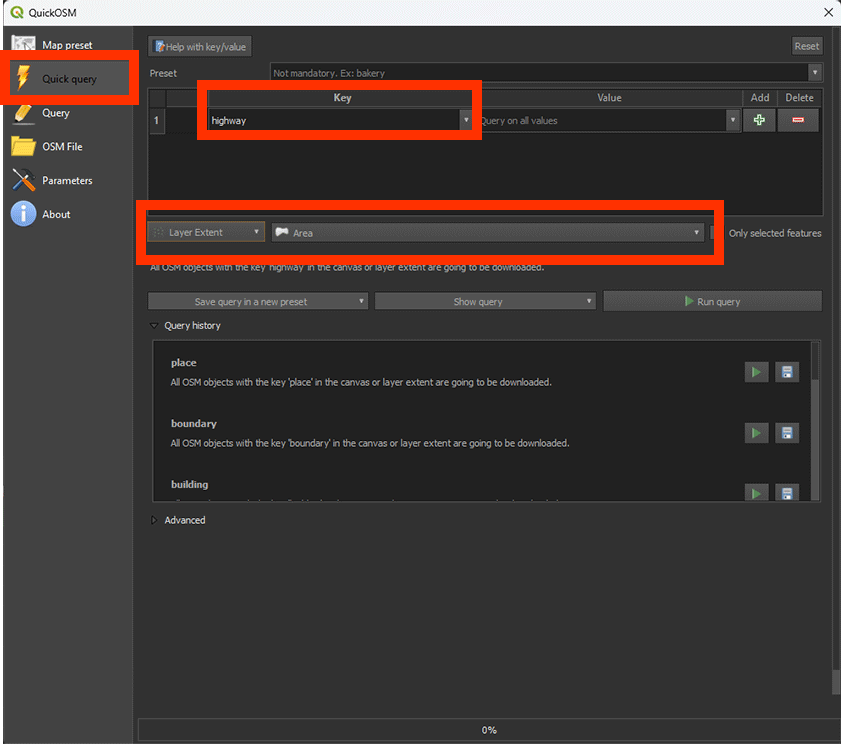
2. In the QuickOSM window, go to the Quick Quiry tab and type highway. This is the layer for the roads. Yes, the naming can be a bit misleading sometimes.
3. Select Layer Extend and select the Area polygon we made earlier. This will extract all the types of roads that are found in our study area.
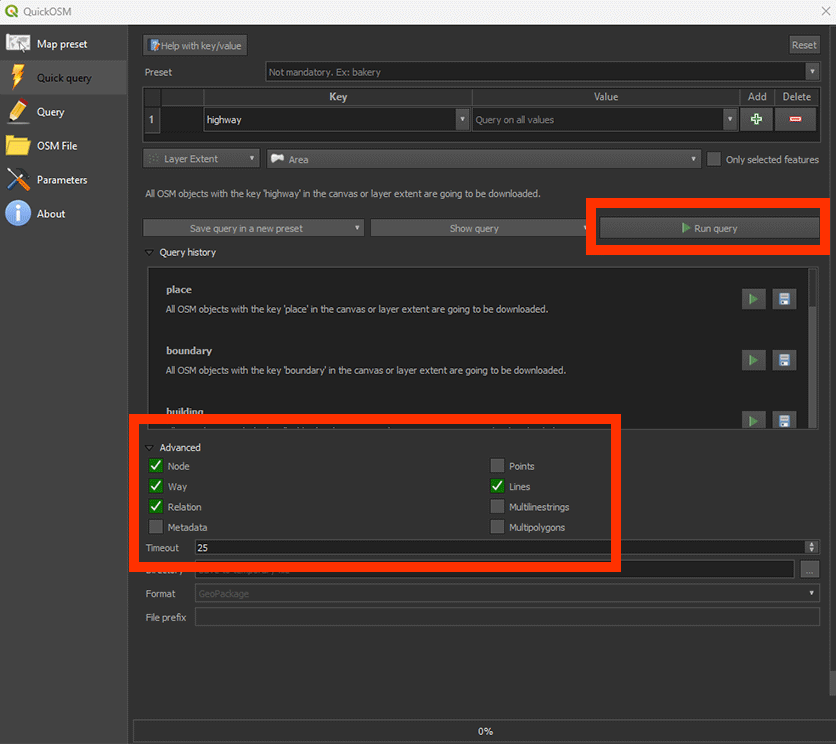
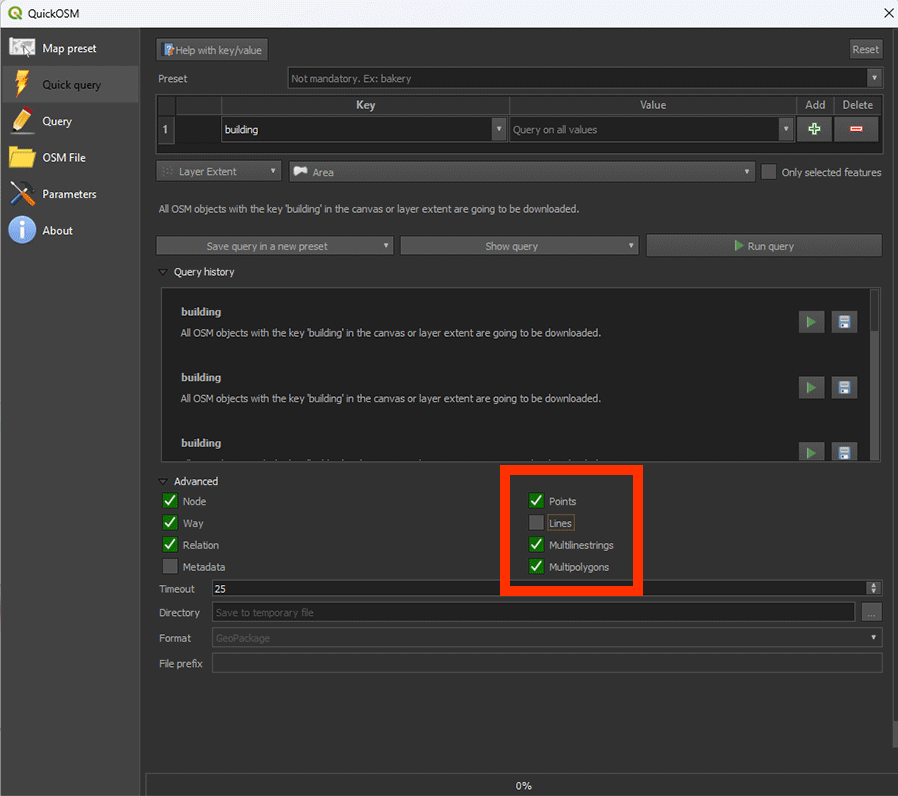
4. Open the Advanced tab. And deselect Points, Multilinestrings and Multipolygons. As we want to use roads, we only need the Lines for our analysis.
5. Click on Run Query and close the window.
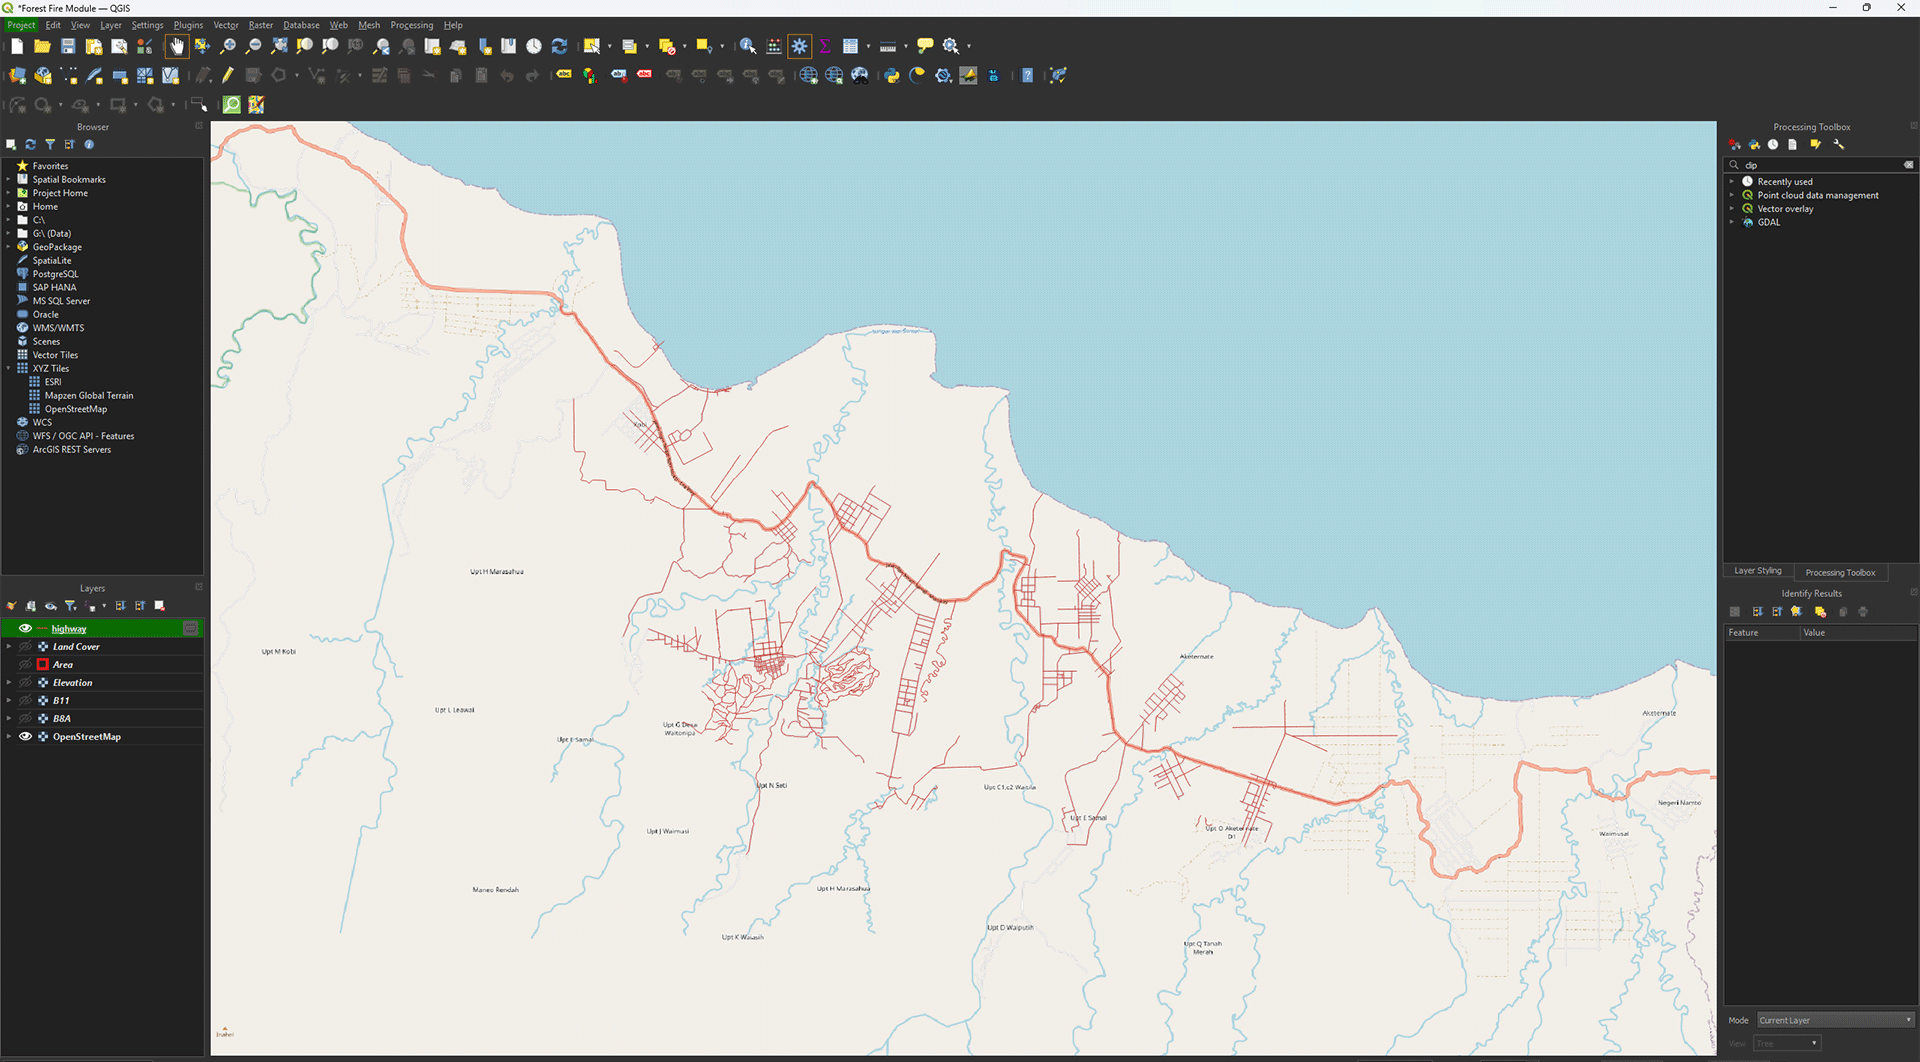
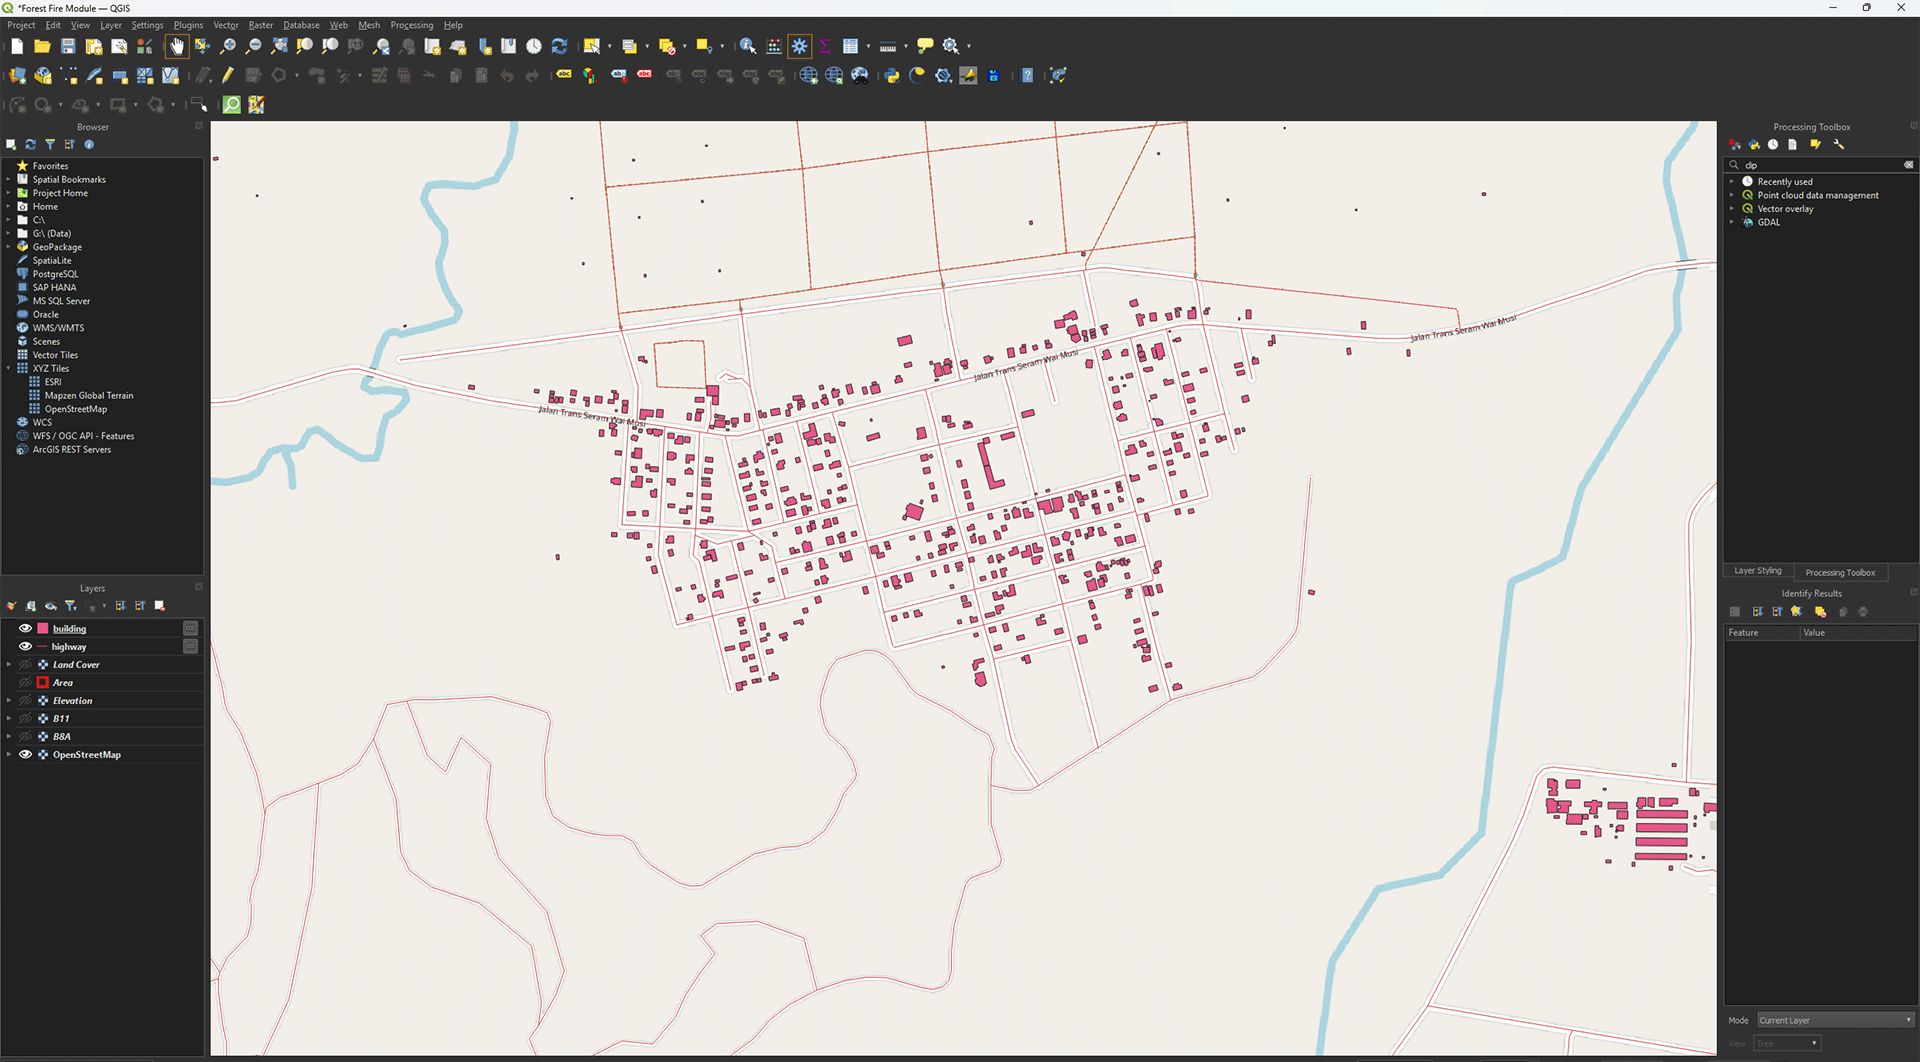
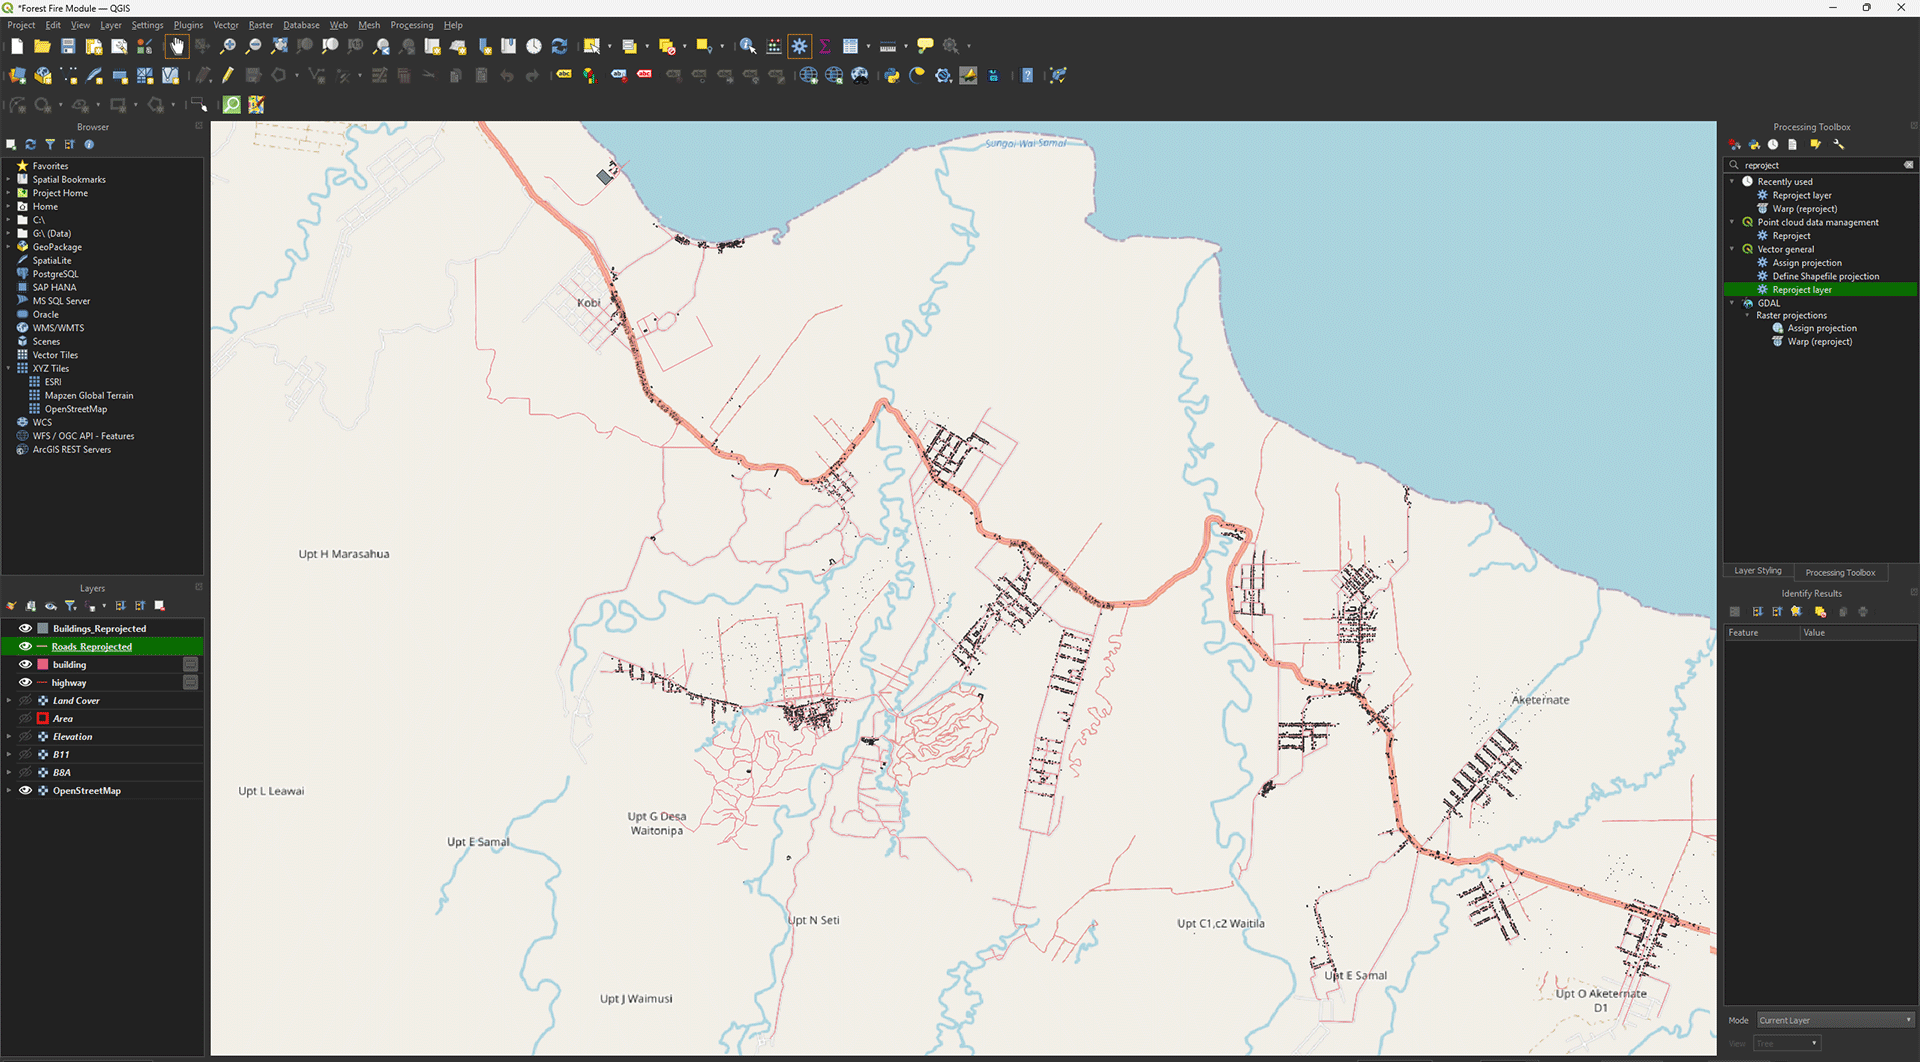
The roads in our study area now appear on the map as lines. They may have a different colour on your map, but that is not important.
6. Repeat these steps by using the following settings to download the buildings.
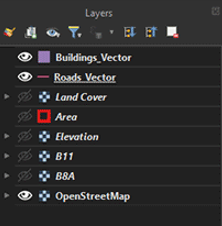
Once downloaded, you should have two layers. Highway in lines and Buildings in Polygons (rectangular shapes).
The layers we just downloaded are vector layers, while the other layers like the DEM and satellite layers are raster layers. The main difference is that a vector layer consists of points, lines and polygons. In the case of the highway layer, it’s made of vector lines. A raster layer is made up of a grid of pixels, each with a unique value. You can clearly see this difference if you zoom in and turn on the Elevation layer. The pixel structure becomes visible compared to the sharp lines of the vector layer.
Reprojecting
Much like the other layers, we first need to Reproject it. However, we have to use a different tool for vector layers instead of the one we used for the raster layers. Make sure you have the Highway and Building layers open. Turn off all the other layers by pressing the Eye button next to the unwanted layers.
1. Go to the Processing Toolbox and search for Reproject layer under Vector general. Double click to open the tool.
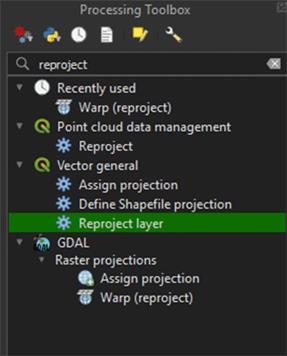
The tool is meant for reprojecting vector layers. The tool we used earlier to reproject our rasters cannot be used for vectors and vice versa.
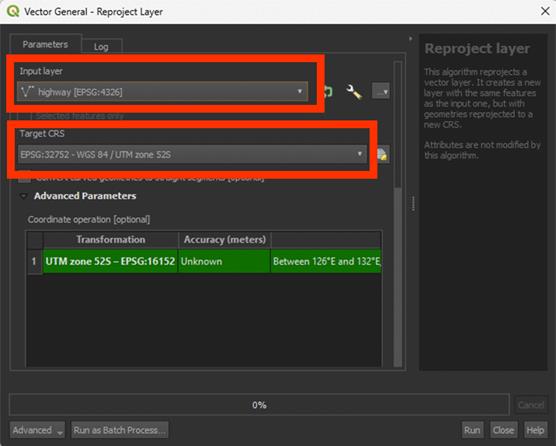
2. In the Reproject Layer window, set Input Layer on highway.
3. Set Target CRS to EPSG: 32752.
4. Scroll down and under Reprojected, press the arrow button > Save to File… and name the Permanent layer Roads_Reprojected. A vector layer will be saved as a Shapefile (SHP).
5. Run the tool and once finished, close the window.
6. Repeat the same process with Reprojecting for the Building layers. Name the layer Buildings_Reprojected when saving it as a Permanent layer.
When processed, all layers should be in the correct coordinate system. You check it to make sure by going to Properties > Source. It should be EPSG: 32752. As they are vector layers, they don’t have a resolution like rasters have.
Dissolve
One issue we come across when downloading vector data, is that all the lines/points/polygons are separated. Very useful if you need the data inside, but for our purpose, we just want the shapes of the roads themselves.
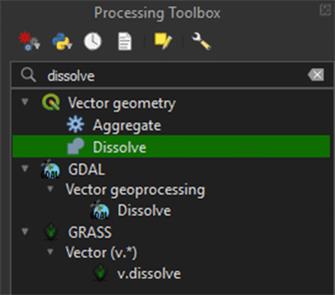
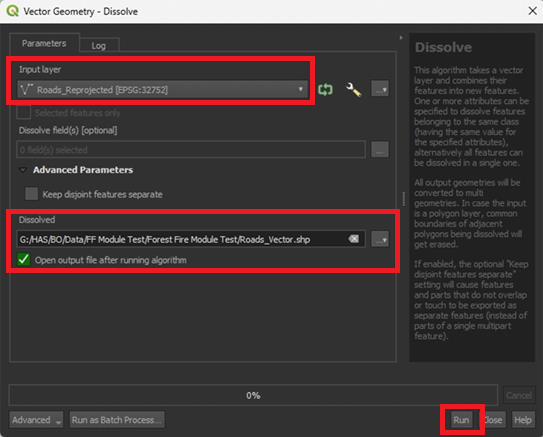
1. Go to the Processing Toolbox and search for Dissolve under Vector geometry. Double click to open the tool.
Dissolve will let us combine every lose shape into one big shape of roads. If we don’t do this, it’ll be impossible to create a clean Buffer later on.
2. Make sure the Roads_Reprojected layer is selected, save the Permanent layer as Roads_Vector. Run the tool.
3. Repeat the same Dissolve steps for the Buildings_Reprojected layer. Save the Permanent layer as Buildings_Vector.
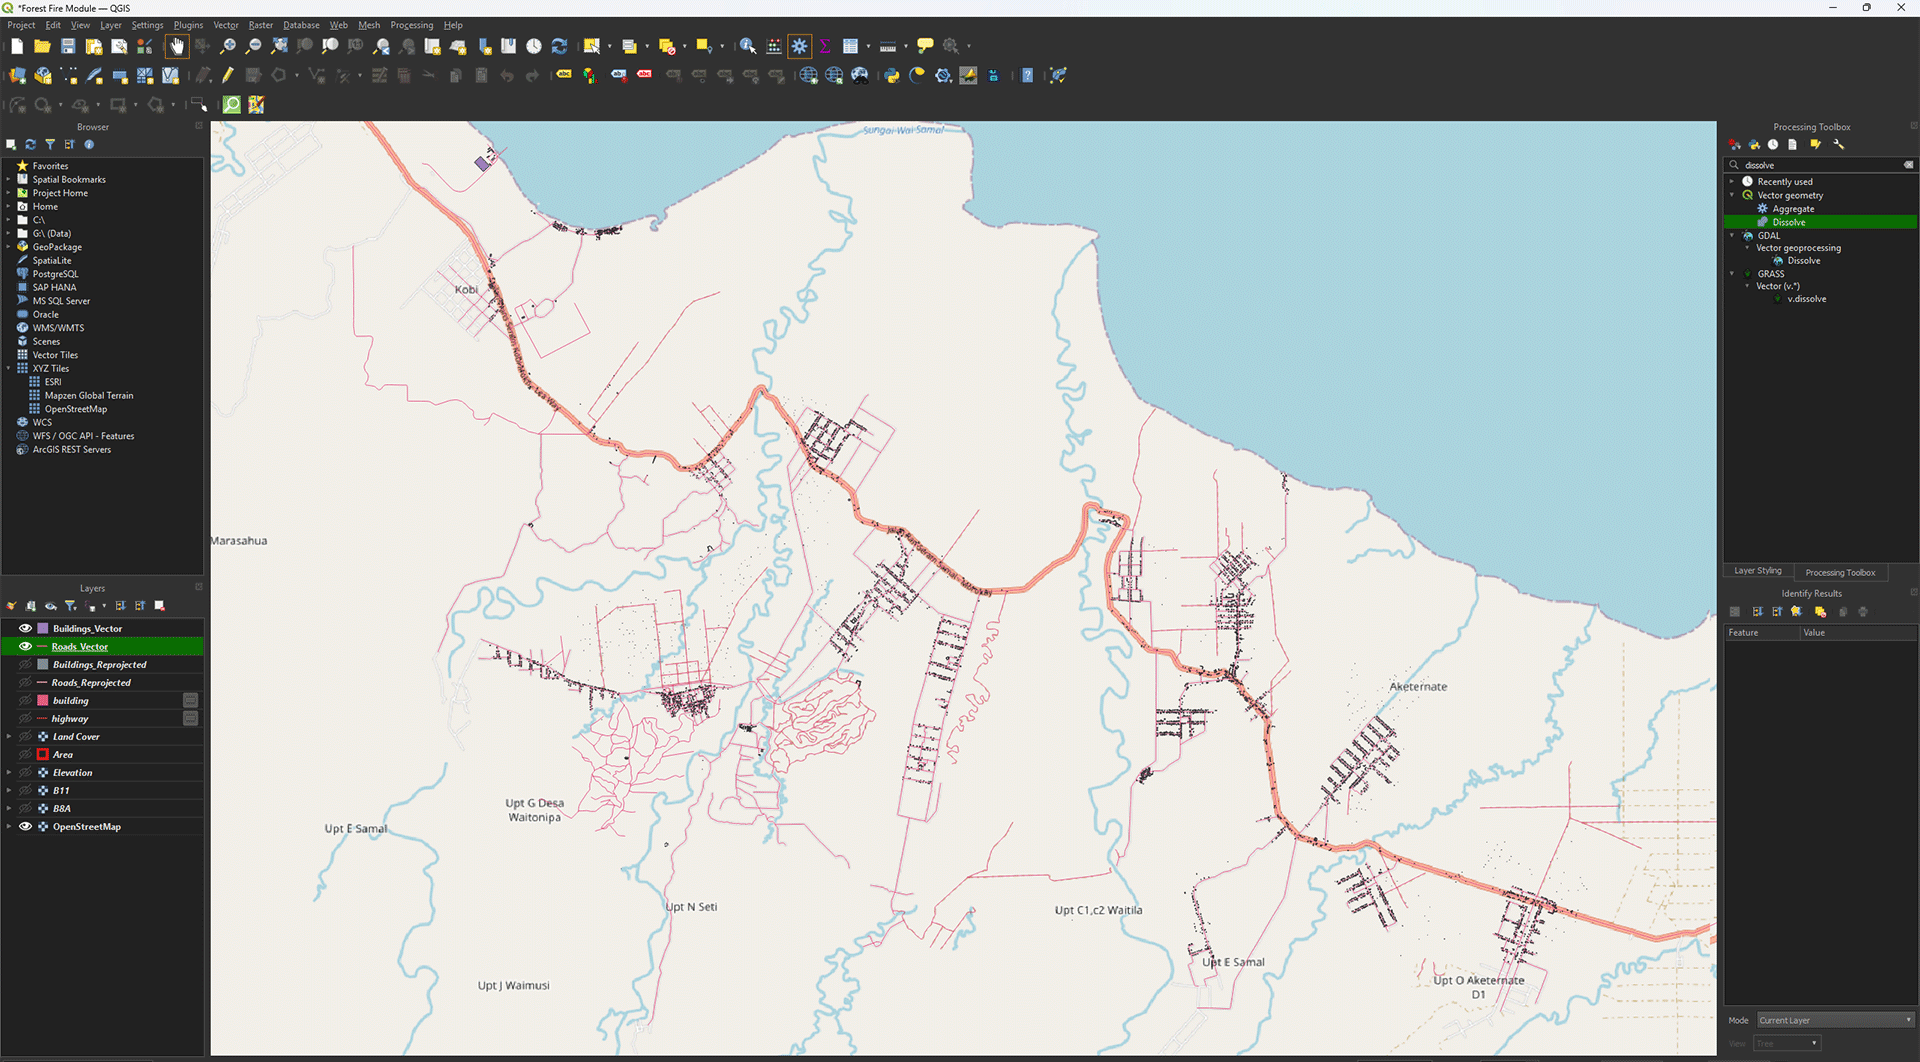
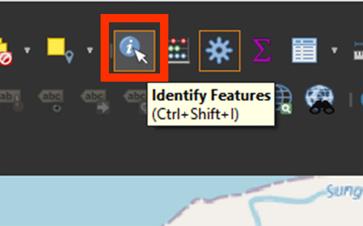
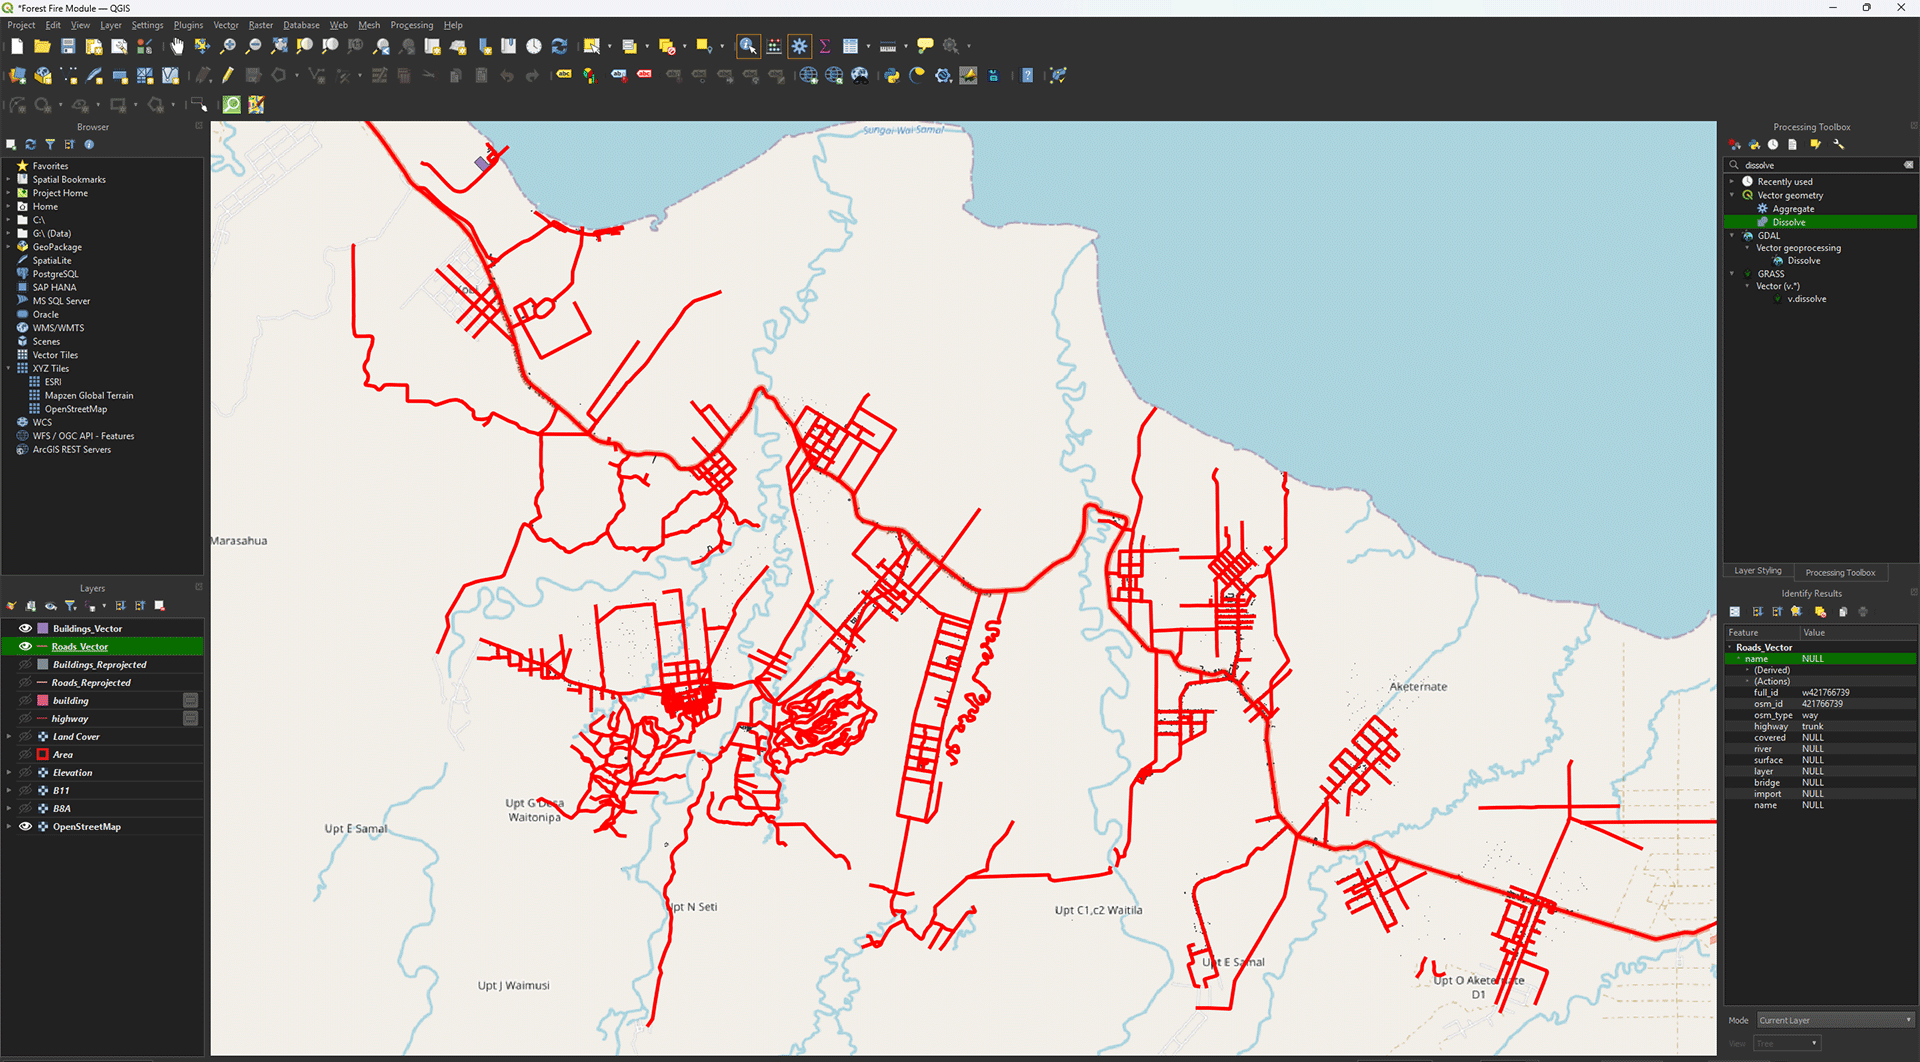
Now all the individual vector shapes are combined in one layer. You can click on a line with Identify Features (ctrl + shift + i) and see all lines light up at the same time.
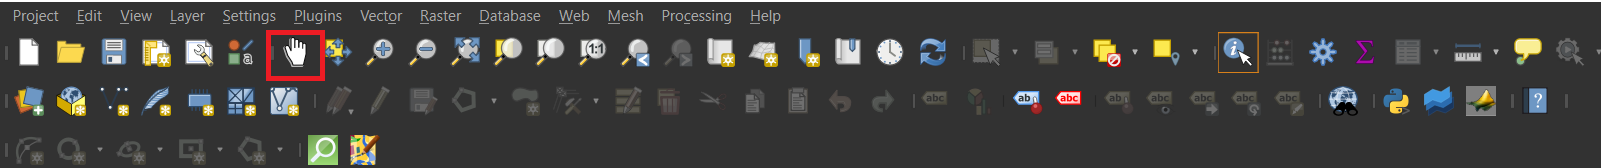
To go back to moving the map with your cursur, press the Pan Map icon
4. Once finished, you can delete the highway and building layers we downloaded, and the Roads_Reprojected and Buildings_Reprojected layers.

You have reprojected and dissolved both the Roads and Buildings layers. This is the final step of 2. Data and Preparation. In the next chapter, we will start on performing the analyses using the data we just imported and cleaned up. Make sure you have saved your project.