
Fire Risk Map
Learn how to create a Fire Risk Map using QGIS and remote rensing.
3. Perform Analyses
3.1. NDMI
Now that we finally have all our data, we are going to perform the first analysis. This analysis will be important, as it will look at the vegetation in the area we want to map. Vegetation is quite flammable and will be a large factor in fire susceptibility and spreading.
As said when downloading the satellite imagery, we are going to use the Normalised Difference Moisture Index, or NDMI for short. This analysis uses near infrared (NIR) and short wave infrared (SWIR) to calculate the moisture content of vegetation. It is as if we can take a peek inside the plants to see how much water they hold. However, there are other ways to find out what vegetation is more susceptible to fires and it’s important to choose the one that fits your goal. If you want to make a full overview of what vegetation would be susceptible, you’d need to know what types of vegetation are found in your study area. This can be quite difficult and complicated, but it will give you the most in-depth overview of the area’s vegetation.
For this module, we will take a more simplified and quicker approach. The main thing we want to know is the moisture content of the vegetation in our study area. As it is a more global approach compared to looking at all the different vegetation types, we will make certain assumptions. The assumption being that a plant with higher moisture content is less susceptible to fires than a plant with lower moisture content. This won’t give us the most accurate map, but this is an alternative that gives us a good idea of what parts are more and less susceptible to fire. It’s always important to make sure that you know how accurate your data and analysis will be before you actually start analysing.
Calculating the NDMI
Let’s start with the first analysis, which will be the NDMI calculation. To do this, we will need the two satellite images we’ve created earlier, the B8A and B11 layers.
If you have any trouble during these steps, there is a guide video at the end of step 5.
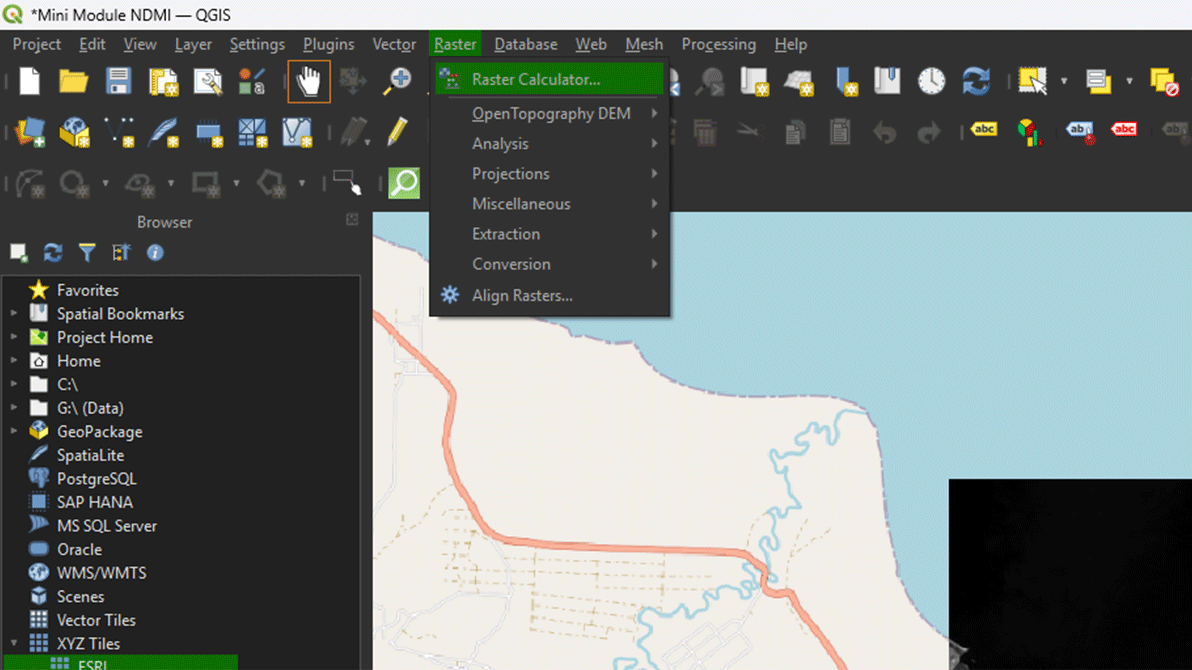
1. Go to Raster > Raster Calculator at the top of the screen. This lets us perform all kinds of calculations on raster layers.
In the calculator you can press the buttons on your screen to make the formula. The calculator is very sensitive to mistakes and will show that there is a mistake in your formula by saying expression invalid beneath the formula input box. The calculator will not run, and you will be unable to click the OK button if this is the case. So, if this happens, double check your formula for any errors. A lot of times the issue lays with a forgotten parentheses “()” in your formula. Another tip to avoid mistakes is to use the buttons on the calculator for the minuses and parentheses instead of using your keyboard.
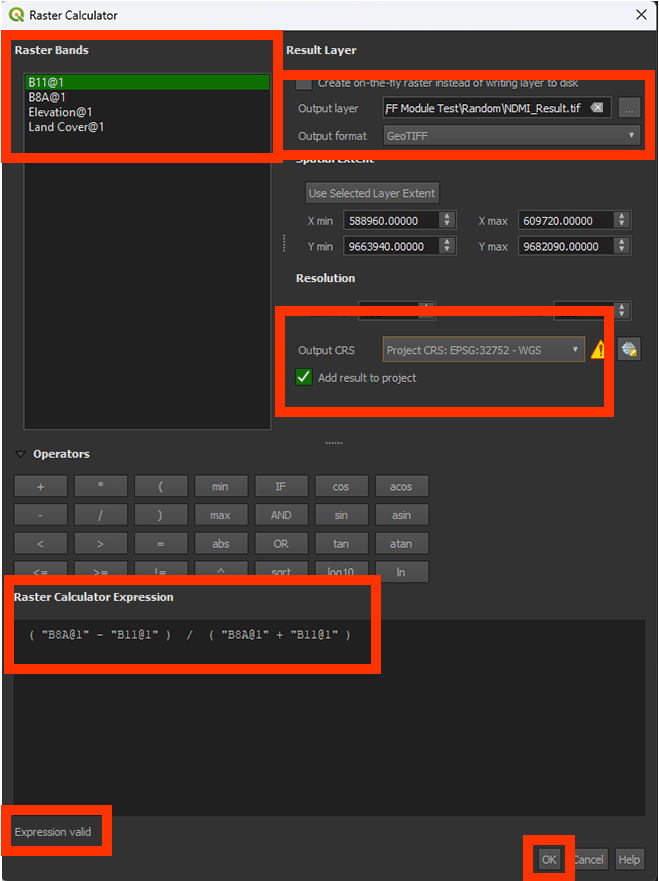
2. In the Raster Calculator Expression, we want to insert this formula (you cannot copy the formula into the input box):
(B8A – B11) / (B8A + B11)
Note: This is the NDMI formula we discussed before: NDMI = (NIR – SWIR) / (NIR + SWIR)
The easiest way to do this is to use the buttons below Operators. Here you can click to add brackets and plus and minus signs. It is also better to double click a layer in the Raster Bands box to add it to your formula. This way you can avoid spelling mistakes making your expression invalid. QGIS will see any tiny mistake as an invalid formula, so this is why using the operator buttons are often more reliable than using your own keyboard keys.
You can check if the formula is right by looking at the bottom of the Raster Calculator Expression box. Here it should say Expression valid. If it says Expression invalid, check again if the formula is right and you are not missing any brackets.
You can add the layers into the expression by double clicking on the layers in the Raster Bands panel on the top left.
3. Name the Output layer on NDMI_Result and make sure the Output format is a GeoTIFF.
4. Check if the Output CRS is set on the correct coordinate system: EPSG: 32752.
5. When you have done all the steps, and the Expression is valid, click OK to calculate the NDMI.
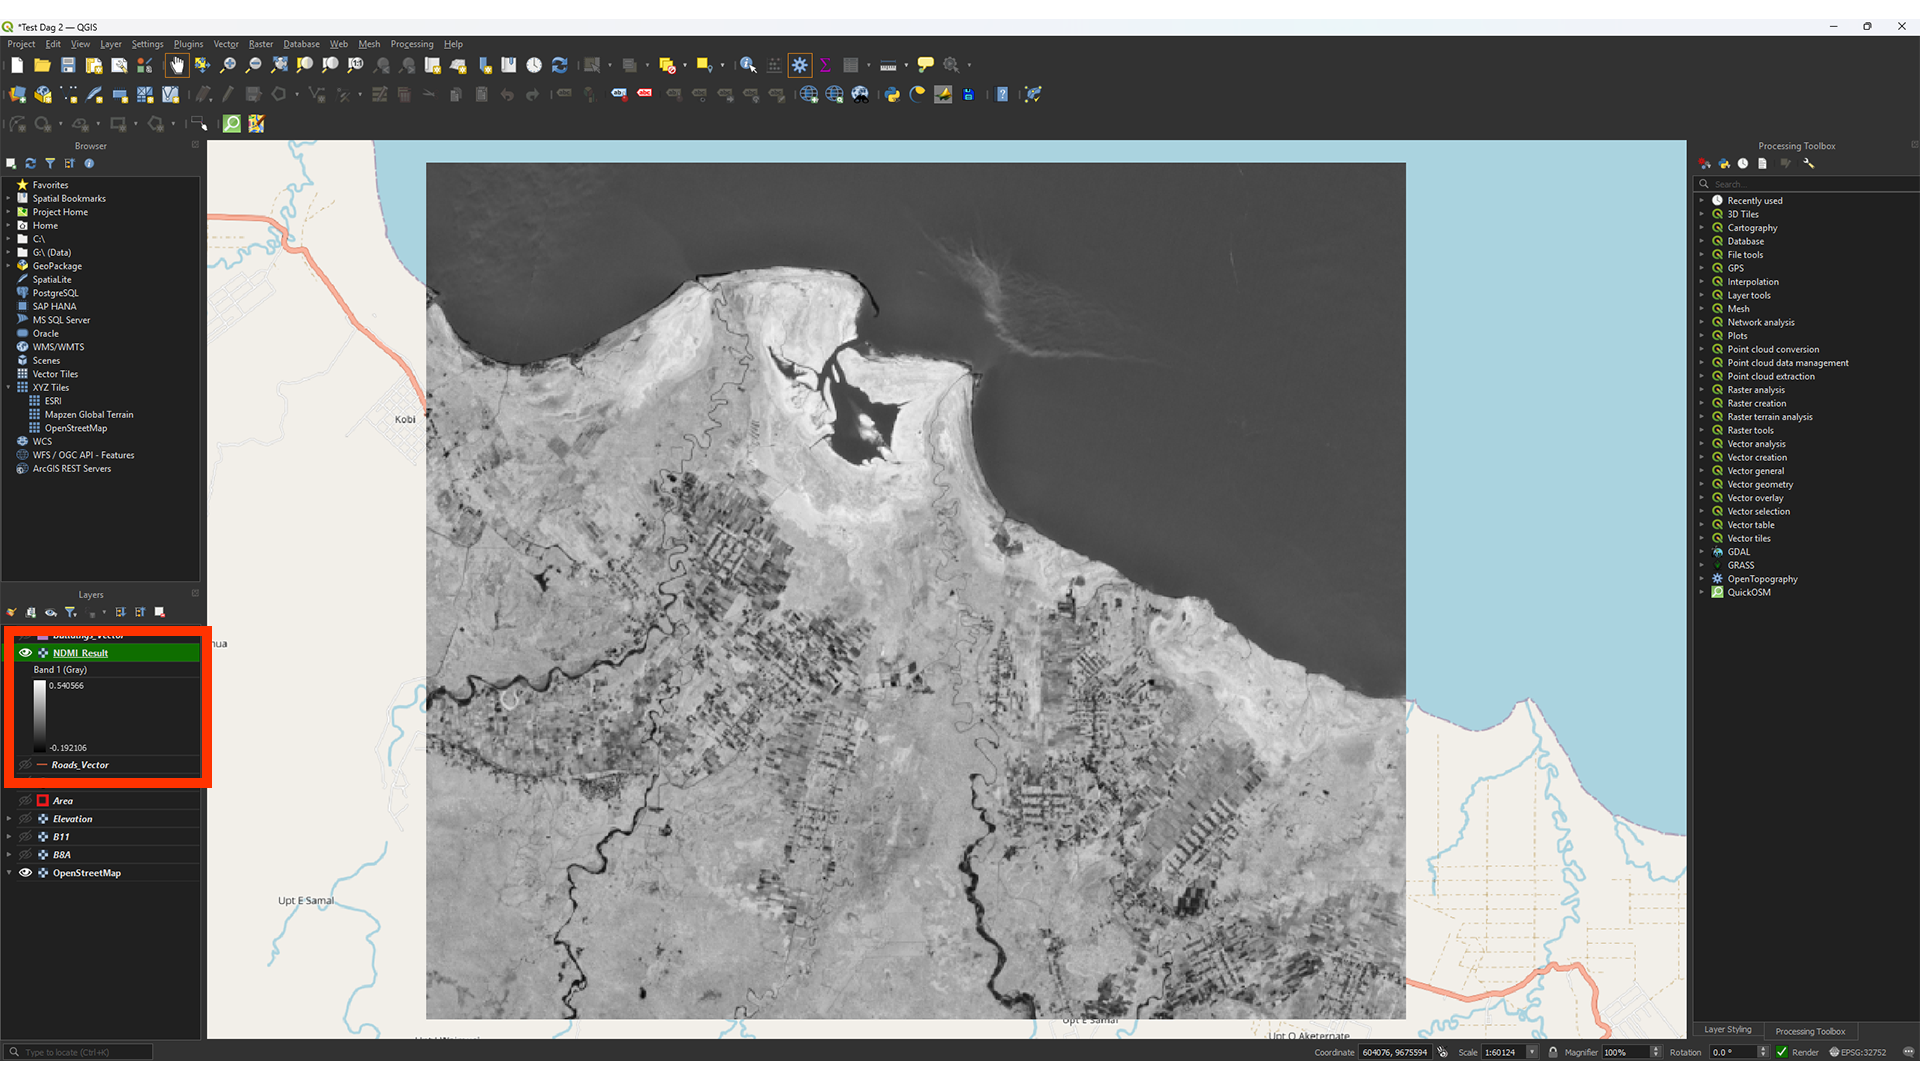
As you can see, the result is a greyscale image. On the left in the Layers panel, you can see the values, which should range between -1 and +1. Higher values show what vegetation contains more moisture.
Note: Depening on your study area's size, the values may differ slightly. It should be fine as long as the value is between -1 and +1.
If you have any trouble with these steps, you can watch this guide video
Applying Symbology
We want to make it a bit easier to read by changing the symbology. This is a step that you can use to understand your results better.
1. If you don’t have the Layer Styling panel open, you can add it by going to View > Panels > Layer Styling Panel.
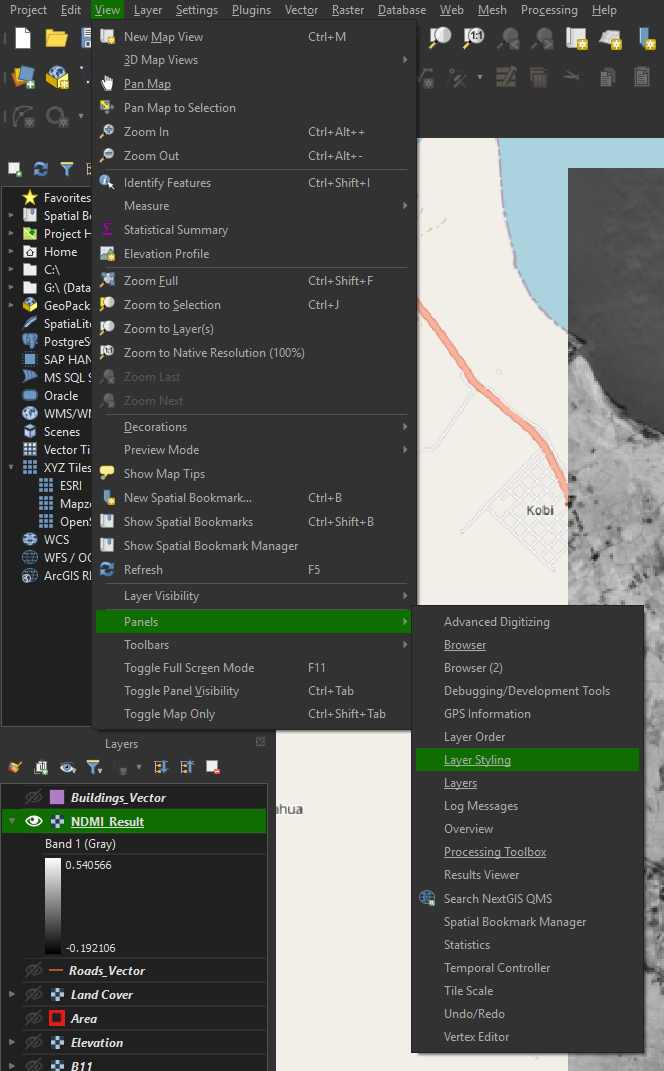
Note: You can find other panels in here as well, if you ever find that you lost them.
We will just adjust the colours for now. The exact classification isn’t important, but changing the styling gives you a better idea of what you’re looking at.
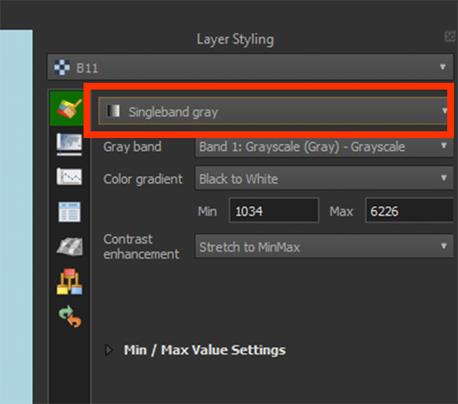
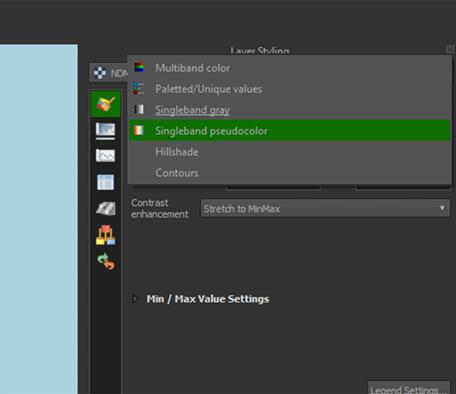
2. Set the renderer to Singleband pseudocolor. It’s usually set on Singleband gray when opening the panel.
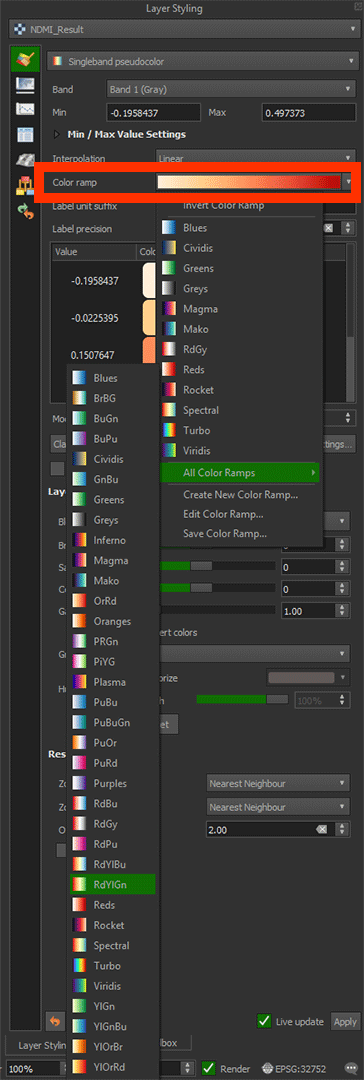
3. For a better viewing experience, we will change the Color ramp to RdYlGn by pressing the arrow next to the Color ramp > All Color Ramps > RdYlGn. (It is possible that it defaulted to this color ramp, in that case you don't have to change it.).
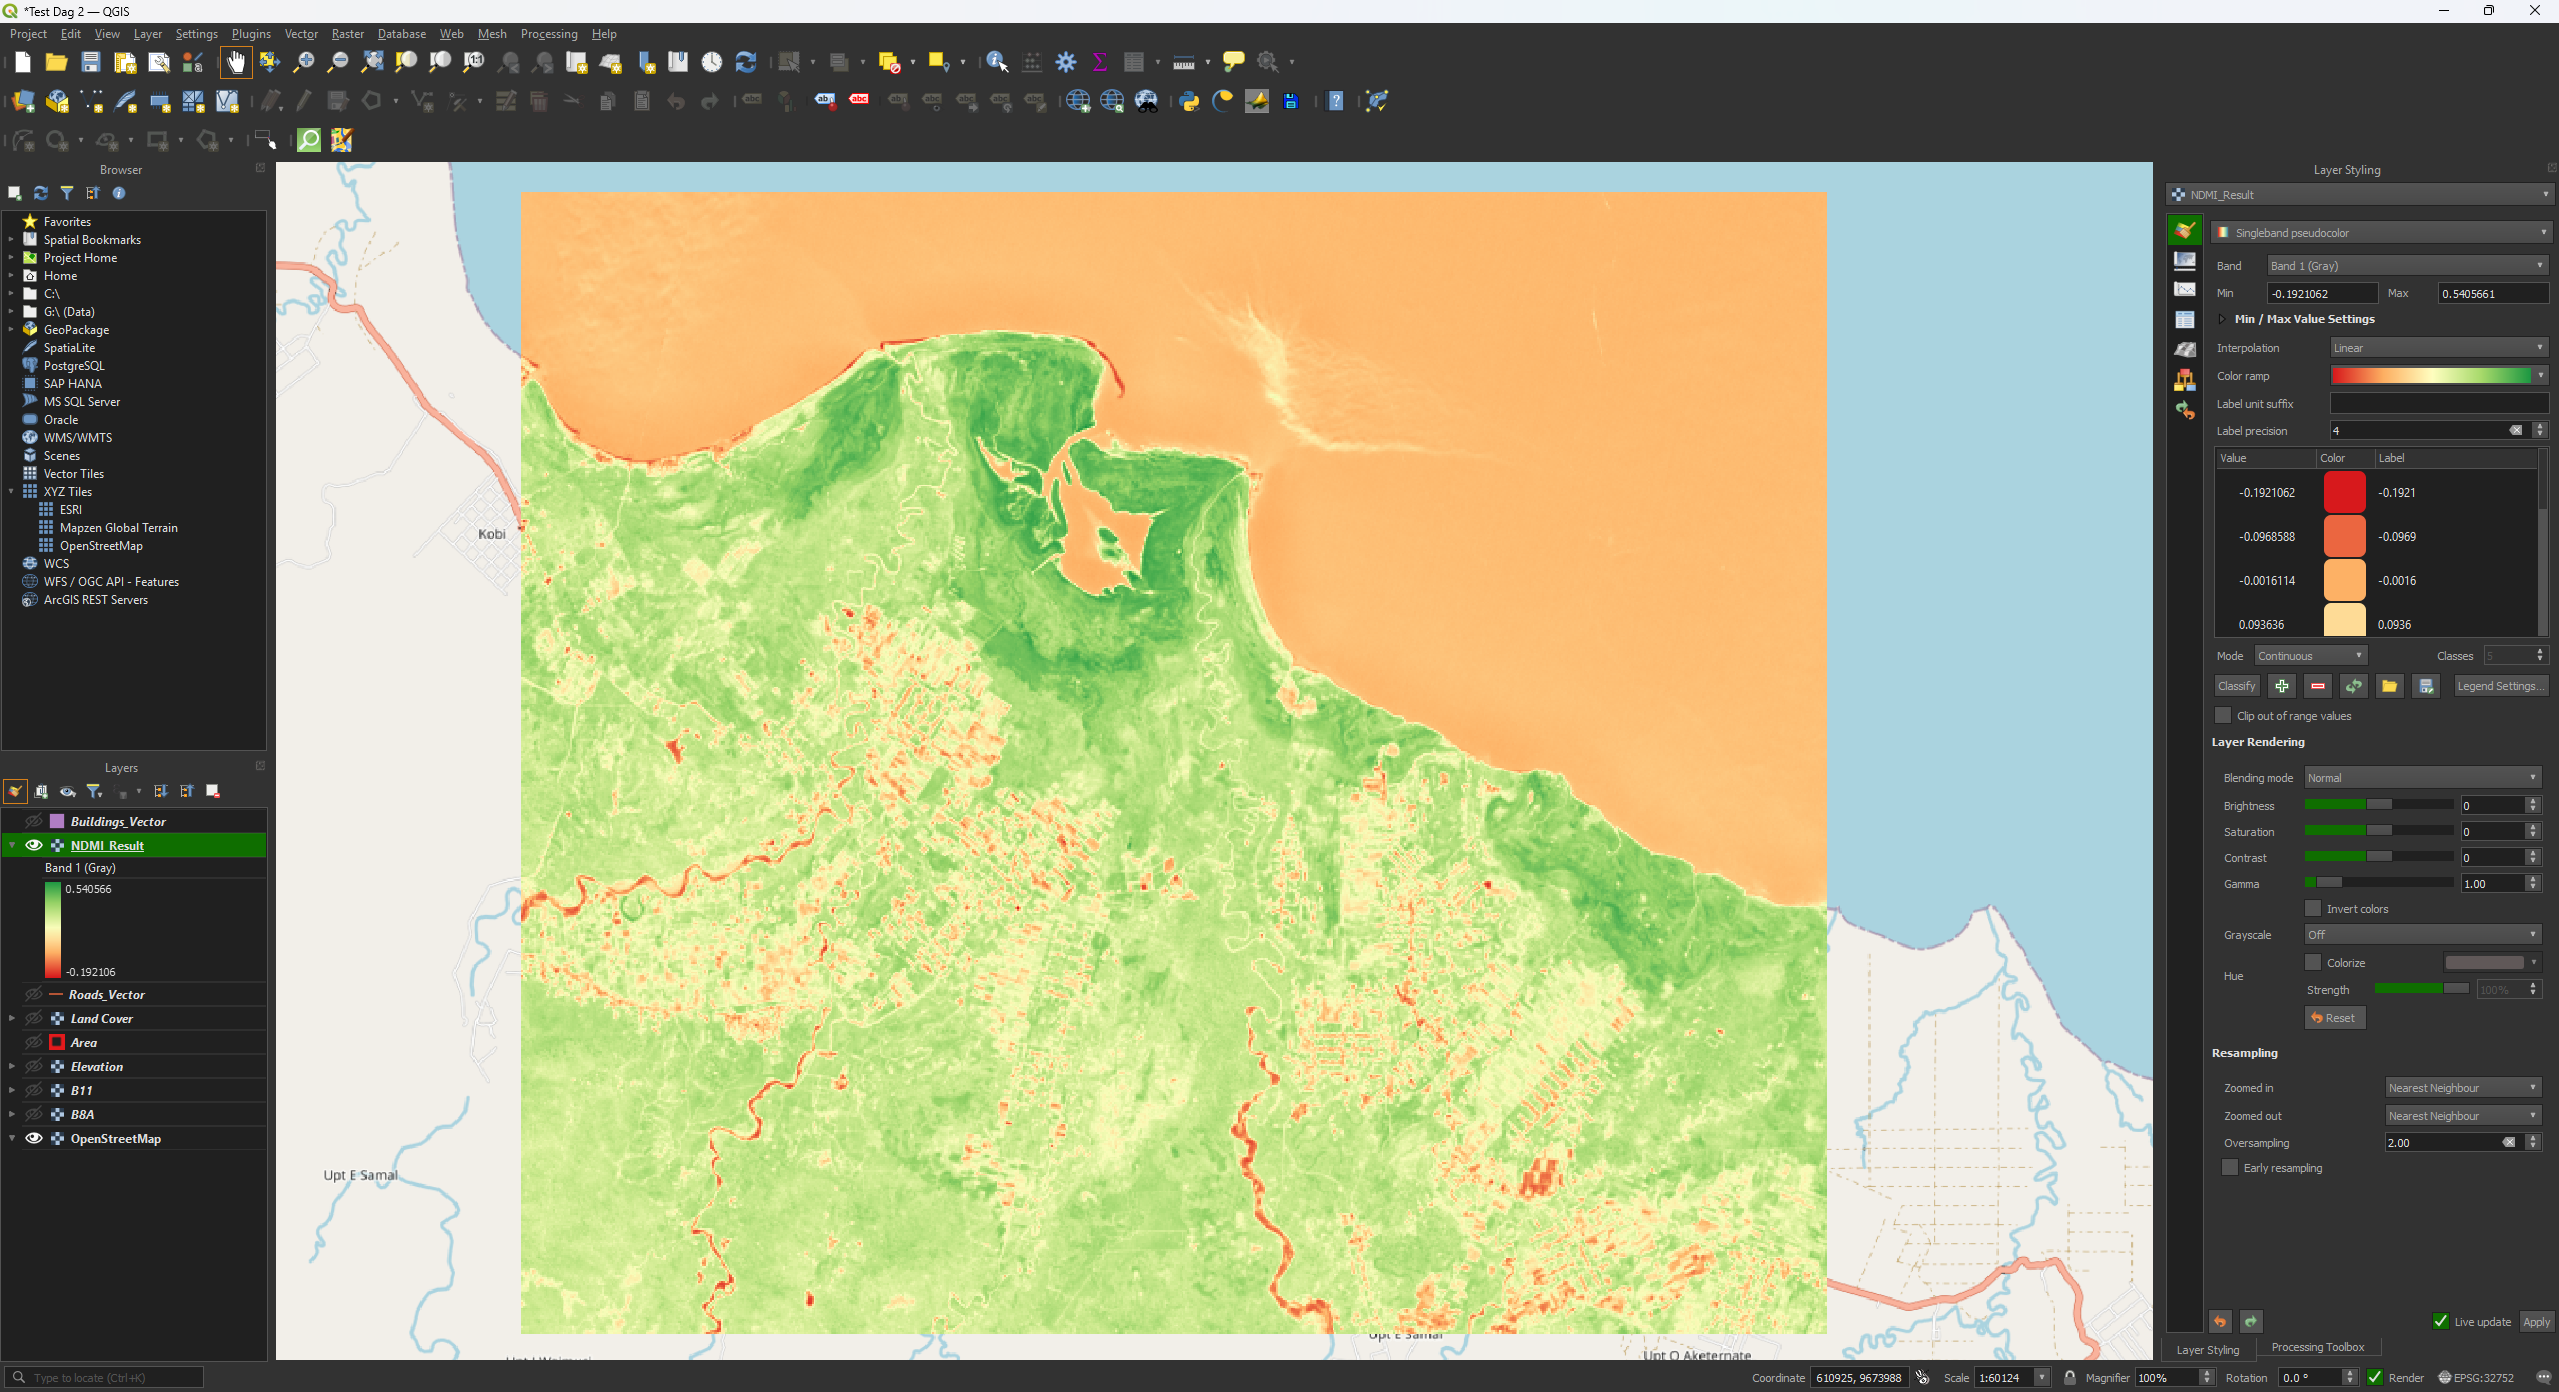
Now you see that the redder colours represent less moisture, or more water stress. The green areas contain vegetation with more moisture, or less water stress. For this index, you’d look at the values like this:
|
Value |
Description |
|
-1 to -0.5 |
Barren |
|
-0.5 to 0.3 |
Stressed, low moisture |
|
0.3 to 1 |
Low stress, high moisture |
Later on in the module, we are going to put these values into the Layer Styling to give the values a Risk classification. But for now, it's just a visual indicator and you can leave it like this.
Don't forget to save your project.
NDVI as an Alternative
A commonly used analysis is the Normalised Difference Vegetation Index (NDVI). This uses the spectral bands to monitor the vegetation’s health. This is very helpful for monitoring large areas of agricultural land or forests, although it's mostly used to monitor crops. You calculate what plants are healthy and which are unhealthy or dead. The formula makes use of the NIR B08 band like the NDMI but replaces the SWIR B11 band with B04 for red wavelengths. A healthy plant will absorb the red wavelength and reflect the infrared rays back to the satellite’s sensor. While this can be used for a fire risk analysis, it assumes that unhealthy plants are more likely to catch fire than healthy plants. This really depends on what types of vegetation is found in your study area, as certain healthy plant species do not contain much moisture, while certain unhealthy plants might still contain more moisture inside.
You can calculate the NDVI in a similar way as we did with the NDMI. You get a value between -1 and +1. Everything between -1 and 0 is either no vegetation or dead vegetation. Everything between 0 and 1 shows how healthy the vegetation is. A lower value is unhealthy, and a higher value is healthy.
The NDVI formula: NDVI = (B8A – B04) / (B8A + B04) NDVI = (NIR – RED) / (NIR + RED)
In this module we will not be using the NDVI (only NDMI), so you DO NOT have to do this step.