
Tutorial: Remote Sensing Image Classification with QGIS
5. Using the Semi-Automatic Classification Plugin
5.10. Accuracy Assessment
Once a land‑cover map has been produced, the next essential step is to evaluate how well the classification represents reality. This is where accuracy assessment comes in. In the Semi‑Automatic Classification Plugin (SCP), accuracy assessment provides a structured way to compare your classified map with reference data and quantify how reliable your results are.
In this chapter, you’ll learn how SCP uses your test areas to build an error matrix, calculate key metrics such as overall accuracy, producer’s and user’s accuracy, and the Kappa coefficient, and help you understand where the model performs well and where it struggles. Rather than treating classification as a “black box,” accuracy assessment encourages you to look critically at the outcomes, identify common sources of confusion, and reflect on how training data, class definitions, or spectral similarity influence the final map.
Let's use the SCP tools for accuracy assessment.
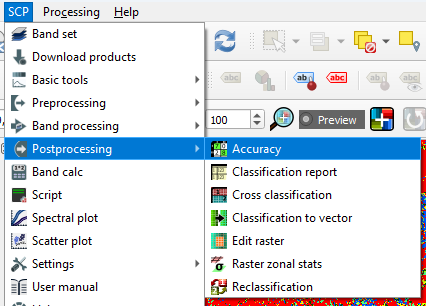
- In the main menu go to SCP | Postprocessing | Accuracy.
- Under Input, choose the cropmap as the classification to assess and select test_areas that we have created before as the reference vector. Use the
 button to refresh the layers list in the drop-down menu. At Vector field choose Class_ID.
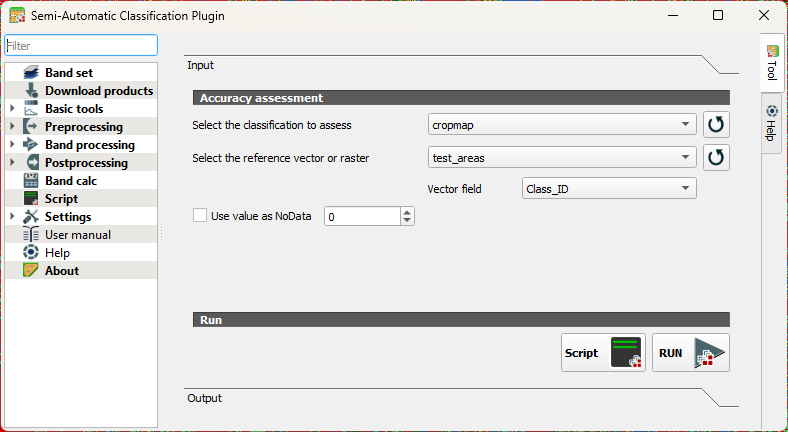
- Click RUN.
- Choose an output location and filename for the rasterized test areas.
When the accuracy assessment is done, the tool will show you the results in the Output section of the dialog.
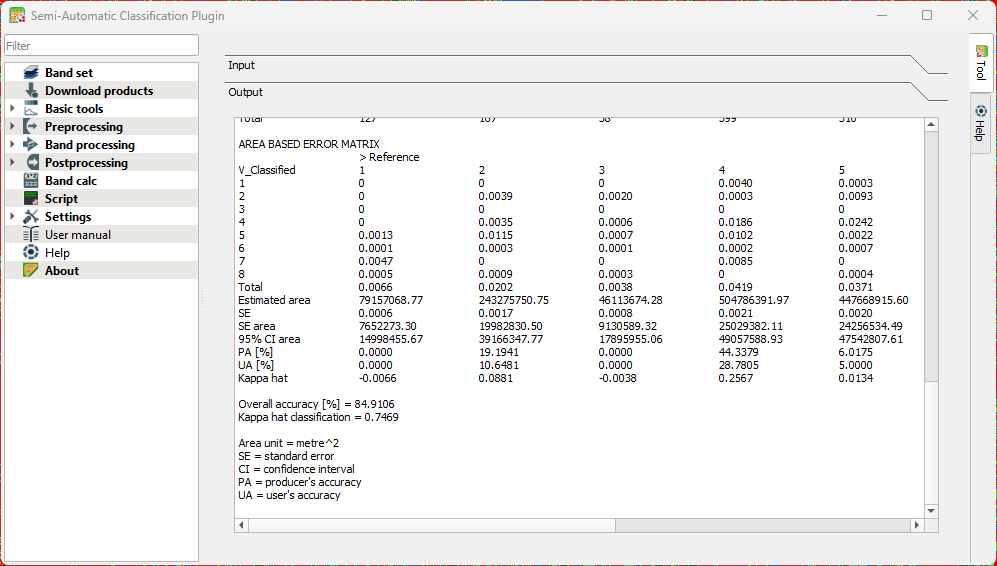
Interpret the result with the following statistics that were calculated:
Standard Error
Shows how much uncertainty there is in an accuracy estimate. Smaller values mean the estimate is more stable and would change little if you repeated the assessment.
Confidence Interval
Gives a range in which the “true” accuracy is likely to fall. Example: 85% ± 3% means the real accuracy is probably between 82% and 88%.
Producer’s Accuracy
Indicates how well the classifier avoided omitting a class. Interpretation: Of all real pixels of this class, how many were correctly mapped? Low values mean many pixels of that class were missed.
User’s Accuracy
Indicates how reliable the map is for someone using it. Interpretation: When the map labels a pixel as this class, how often is that correct? Low values mean many pixels were incorrectly assigned to that class.
Overall Accuracy
The percentage of all validation samples that were correctly classified. A simple, general measure of performance.
Kappa Coefficient
Compares your classification to what would be expected by random chance. Values near 1 indicate strong agreement; values near 0 mean the map is not much better than guessing.