
With satellite data we can explore other parts of the electromagnetic spectrum that are not visible to human eyes. We're going to download a Sentinel image using the STAC API Browser plugin.
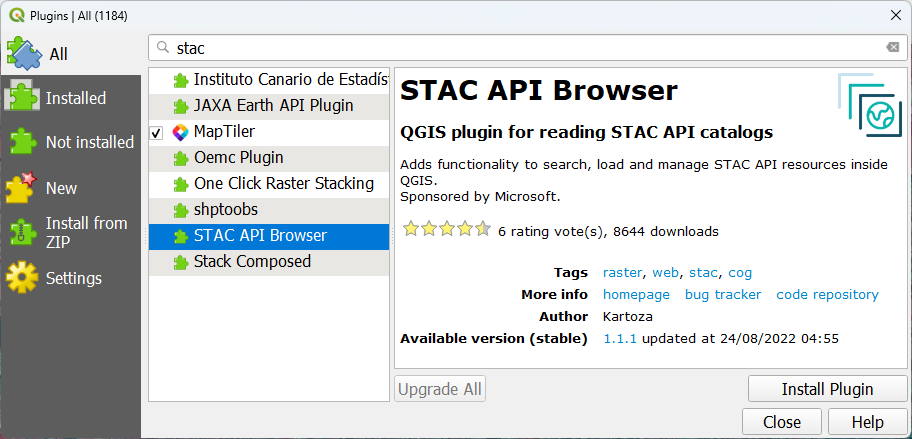
1. Install the STAC API Browser plugin.
2. Zoom to the boundary of the municipality.
3. Click  to open the STAC API Browser dialog.
4. At Connections, choose Microsoft Planetary Computer STAC API.
5. Click Fetch Collections.
6. Select Sentinel-2 Level-2A.
7. Check the box to Filter by date and give a date range from 1 June 2023 - 1 October 2023.
8. Check the box for Extent and click Map Canvas Extent.

9. Click Search.
10. Check the results. We're looking for an image without cloud cover over Rotterdam.
The image of 6 September 2023 looks good.
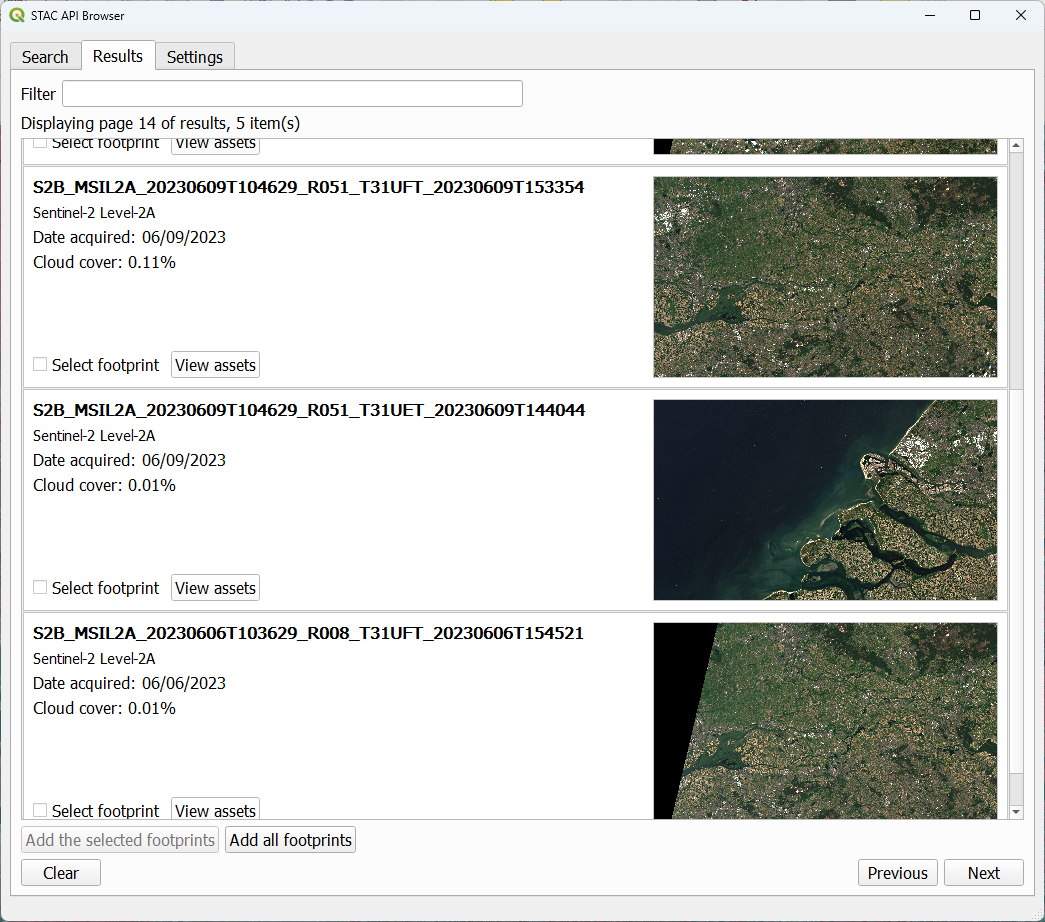
11. At the image of 6 September 2023 click View assets.
12. In the Assets dialog check the boxes to Select to add as layer for bands 2, 3, 4 and 8, which are the visual and near infrared bands.
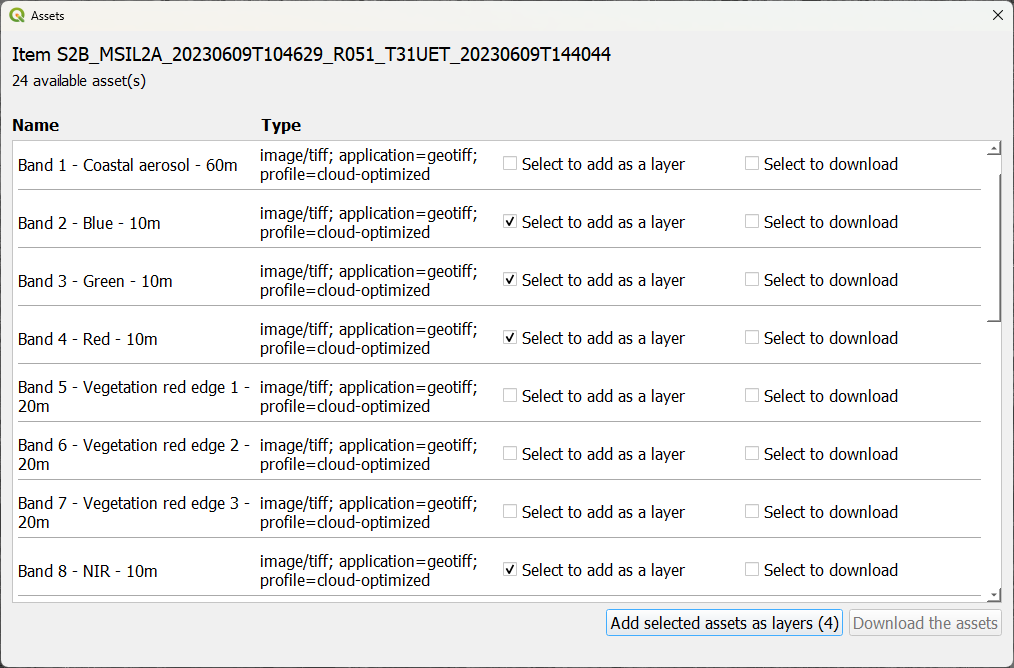
13. Click Add selected assets as layers (4) to add them to the map canvas.
14. Order the layers in the Layers panel so that band 2 is on top and band 8 is at the bottom.
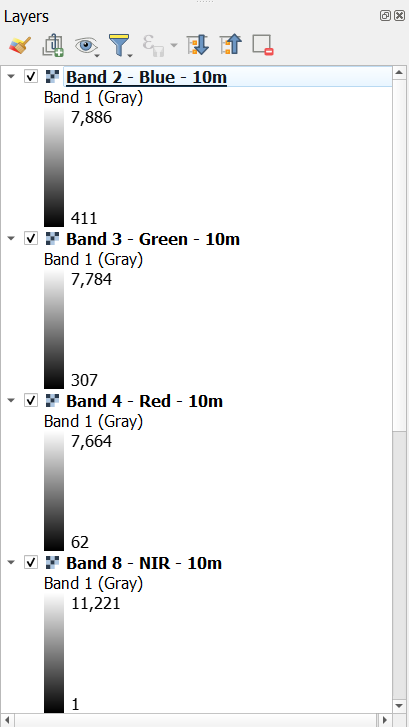
We need to stack these bands in order to visualize them with the Multiband color renderer.
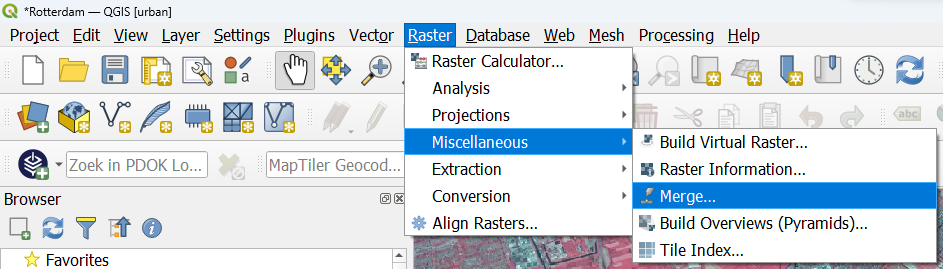
15. In the main menu, go to Raster | Miscellaneous | Merge....
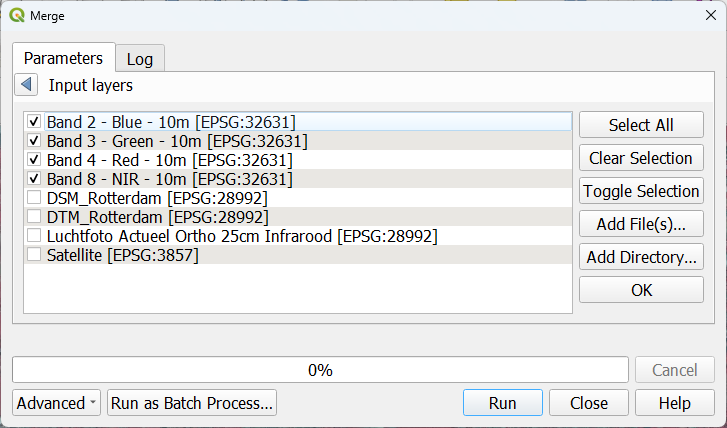
16. In the Merge dialog, click  to select the input layers. Select bands 2, 3, 4 and 8 and click
  to go back.
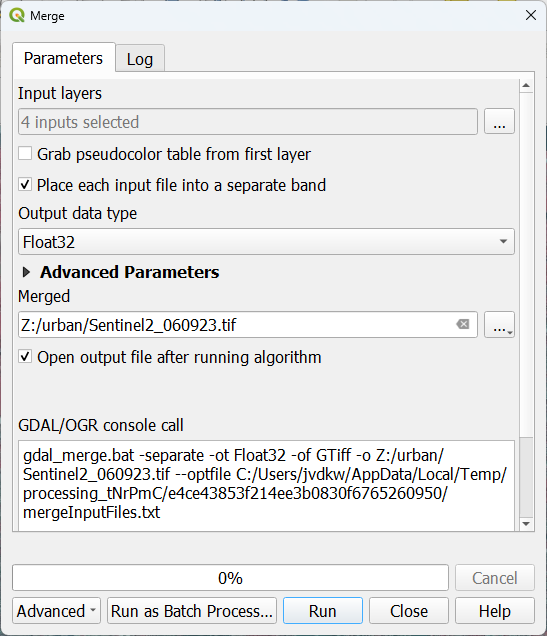
17. Back in the Merge dialog, check the box to Place each input file into a separate band. This will create the stack (multiband) raster.
18. Save the result as Sentinel2_060923.tif and click Run.
19. Click Close after processing.
20. Remove the layers with the individual bands.
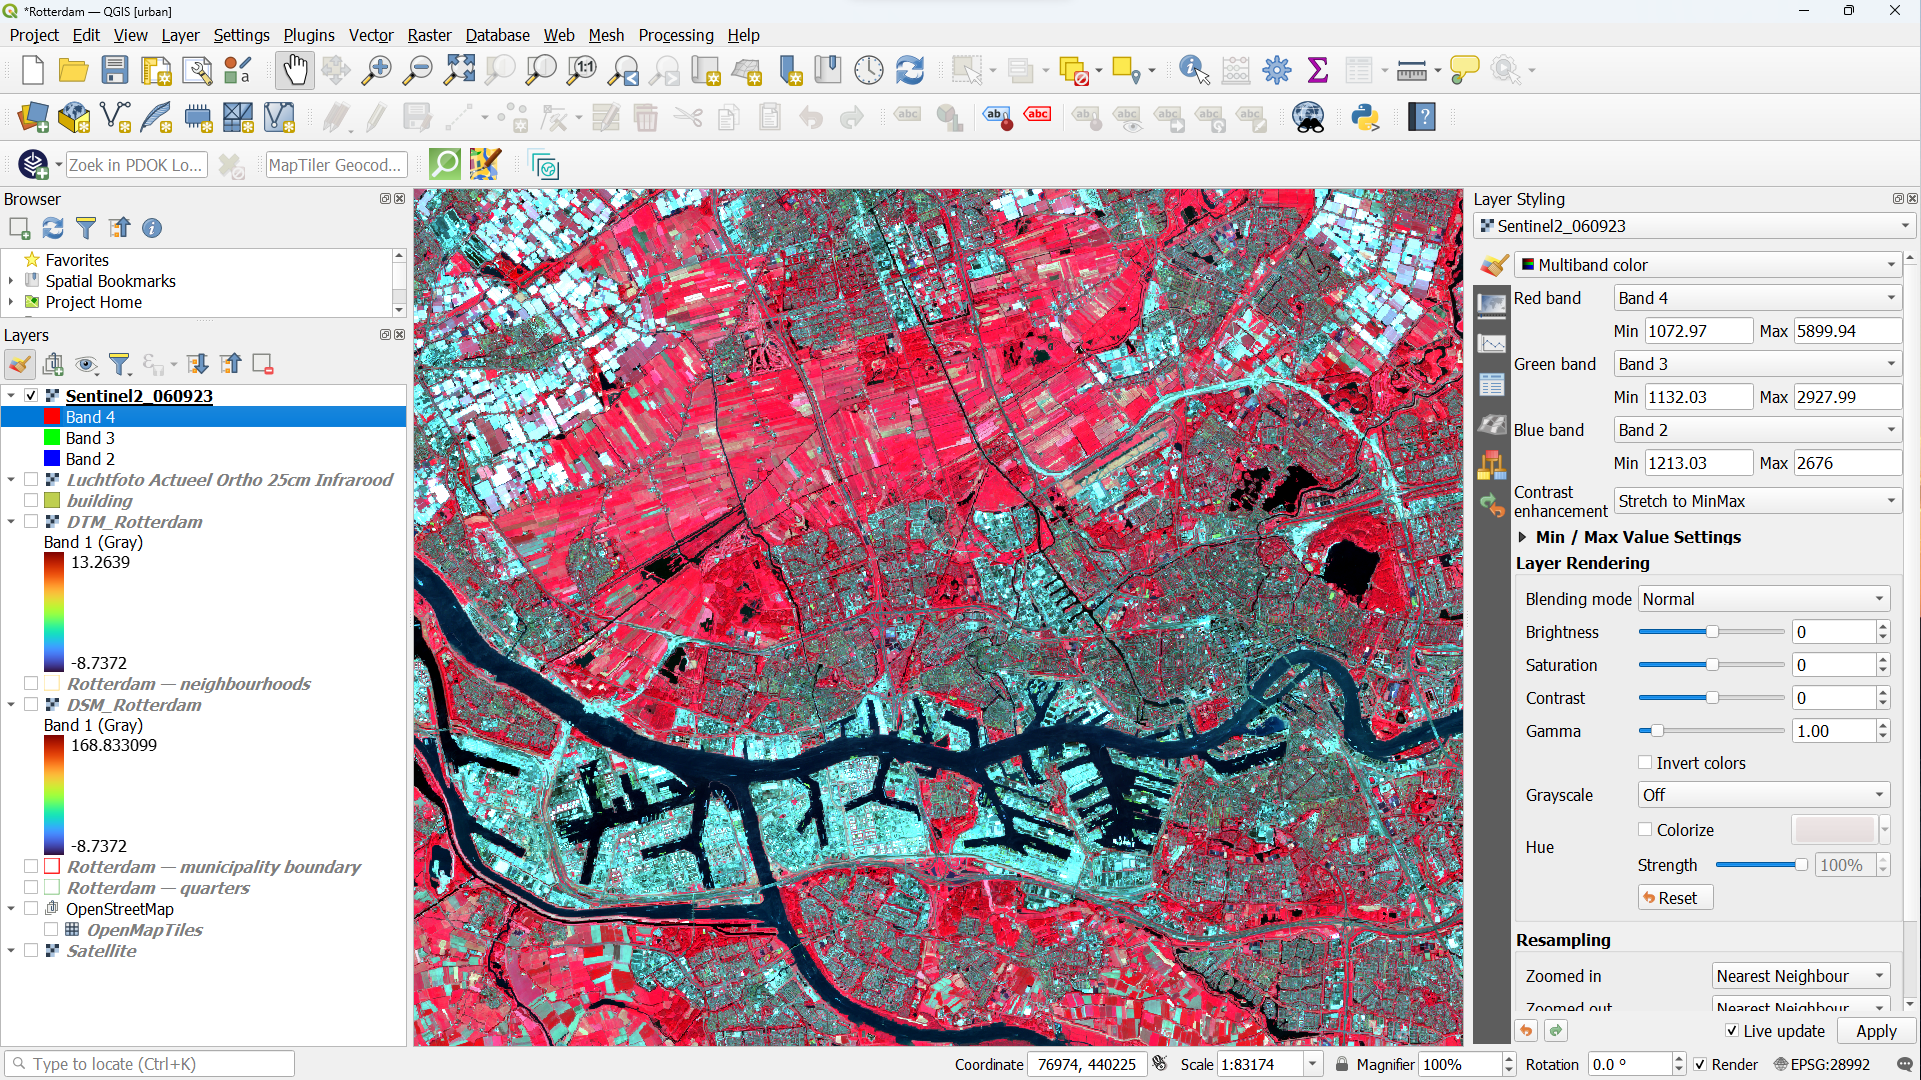
21. Go to the Layer Styling panel. Make sure that the Sentinel2_060923 layer is the active layer.
22. Use the Multiband color renderer to visualize different band combinations.
23. To create a false colour image, similar to the aerial photograph, choose for
This video shows how the STAC API Browser can be installed and used: