In this section, you'll learn to add a temperature image to your project.
1. Go back the STACK API Browser plugin dialog.
2. Choose Microsoft Planetary Computer STAC API at Connections.
3. Click Fetch collections.
4. Select Landsat Collection 2 Level 2.
5. Filter by date from 1 June - 1 October 2023.
6. Choose the Map Canvas Extent (make sure you're still zoomed to Rotterdam)
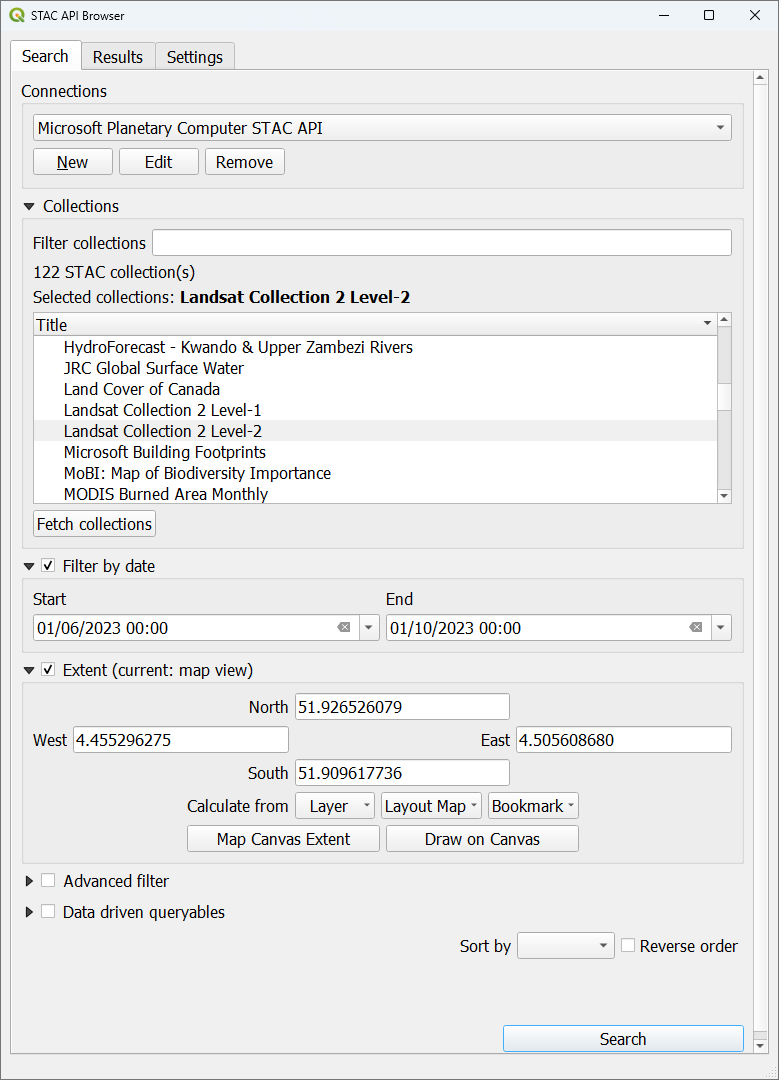
7. Click Search.
8. Look for the image of 9 September 2023 and click View assets.

9. Go to the line of the Surface Temperature band and check the box to Select to add as layer.

10. Click Add selected assets as layers (1).
11. Close the dialogs and check the result in the map canvas.
The values need to be scaled to get the temperatures in Kelvin. You can find more information at this page. It is always important to check the documentation of data sets! Furthermore we want to have the temperatures in degrees Celcius.
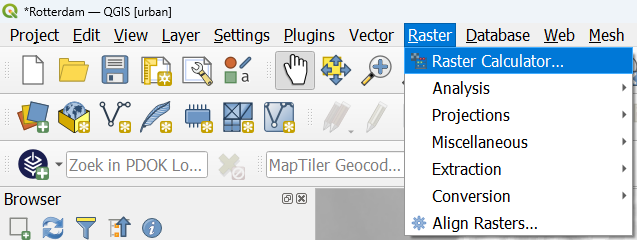
12. In the main menu, go to Raster | Raster Calculator....
13. In the Raster Calculator, double click under Raster Bands on Surface Temperature Band@1 to add it to the Raster Calculator Expression.
14. Compose the following expression:
( "Surface Temperature Band@1" * 0.00341802 + 149.0 ) - 273.15

15. Save the result in your project folder to T_Celsius_09092023.tif. In this way we can easily recognize that it is temperature in Celsius and the date of the image.
16. Click OK.
17. Remove the original Surface Temperature Band layer.
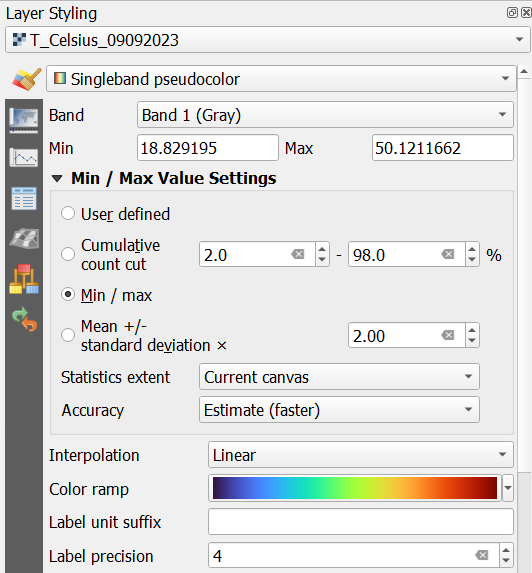
18. Select the new T_Celsius_09092023 layer and open the Layer Styling panel.
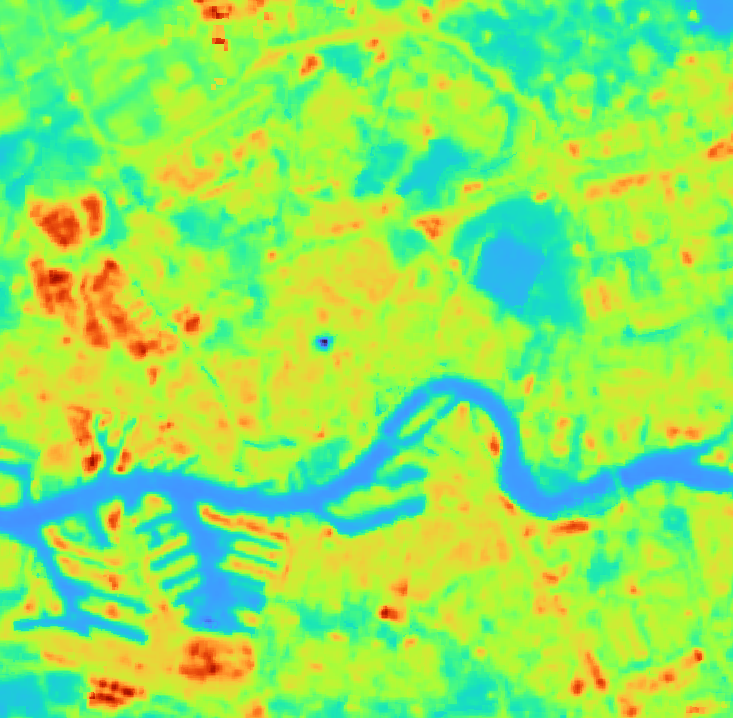
19. Change the renderer to Singleband Pseudocolor and choose the Turbo color ramp. In that way, blue is for cold pixels and red is for warm pixels.
The contrast in the image can be improved.
20. Expand the Min / Max Value Settings by clicking the black arrow.
21. There click the radio button before Min / Max and change the Statistics Extent from Whole raster to Current canvas.
Now the minimum and maximum values of the extent of the map canvas will be used, increasing the contrast. Note that with Updated canvas, the min/max values will be updated when you pan, which will keep the maximum contrast.