
Let's check the areas of the patches. We'll use another tool than the one from LecoS, so you can see the difference.
1. In the Processing Toolbox, go to Raster analysis | Raster layer unique values report.
2. In the Raster Layer Unique Values Report dialog, choose patches as Input layer and save the Unique values report to patch_stats.html in your project folder. Also save the Unique values table to your project folder as patch_stats.csv. Make sure you choose Save to file... and change the format to CSV!
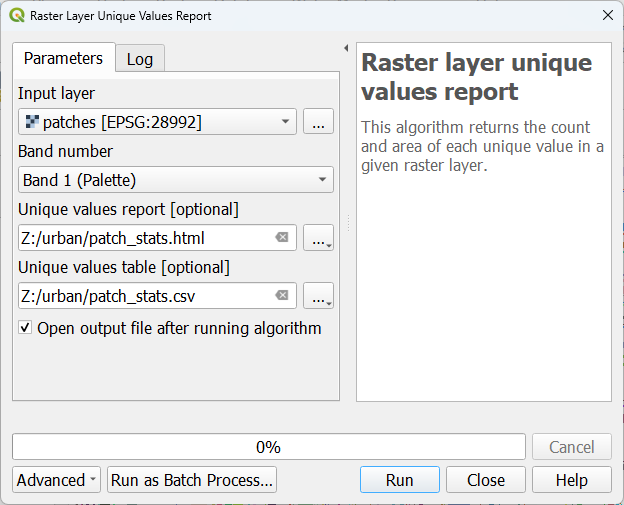
3. Click Run. Click Close after processing is completed.
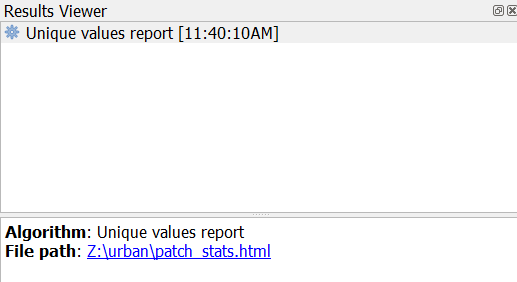
4. View the results. You can double-click on the Unique values report in the Results Viewer panel. This will show the result in HTML format in your browser.
5. The CSV file has been added to your Layers panel. You can open it as an attribute table. You can also open the patch_stats.csv file in notepad using the file explorer. Check the format.
Now we know for each individual patch the surface area in m2. You can use the Field Calculator in the attribute table of patch_stats to select patches that are larger than a certain threshold. Then you can use the Raster Calculator to create a new boolean raster. You can also reclassify the patches. Alternatively, you can also convert them to polygons and use vector processing tools to select the patches that you need. Raster zonal statistics can be used to derive statistics based on another layer.
In another tutorial, we'll use the Raster zonal statistics.