
Our land-use map contains more detail than we need. Let's aggregate classes so it better fits our needs for urban studies.
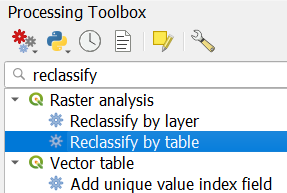
1. In the Processing Toolbox, go to Raster analysis | Reclassify by table.
2. Choose LGN2022_Rotterdam as Raster layer.
3. Click the browse  button at Reclassification table.
We're going to create a lookup table to end up with the following land-use classes:
4. Create exactly the lookup table as given below.
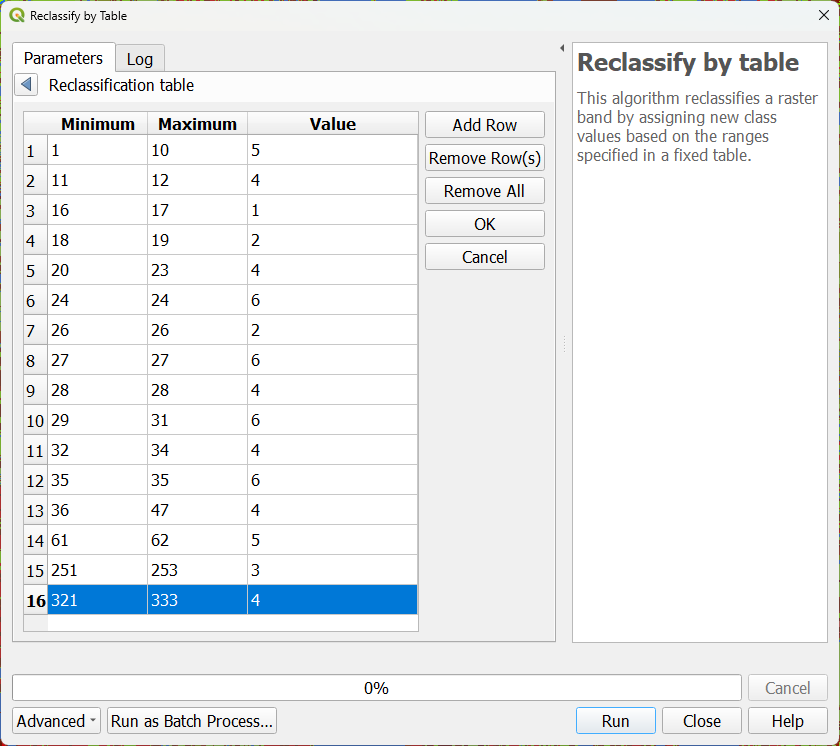
5. Click OK or the blue arrow to go back.
6. Expand the Advanced Parameters section.
7. Change the Range boundaries to min <= value <= max, so it will include both lower and higher boundaries of each defined range in the lookup table.
8. Change the Output data type to Byte. This means that we need 8 bits integers as output, so we can store max 256 values (0 - 255).
9. Save the result to landuse.tif in your project folder.

10. Click Run. Click Close when processing is completed.
11. Go to the Layer Styling panel. Make sure the landuse layer is active and choose the Paletted/Unique values renderer.
12. Click Classify so each value in the raster gets a unique colour.
13. Modify the colours and class labels so that the raster has intuitive colours and the class names.

Now let's use this aggregated land-use map for analysing spatial metrics at the landscape level.