
We're going to explore connectivity of green infrastructure in the urban environment.
1. In the Processing Toolbox, go to LecoS | Landscape statistics | Patch statistics.
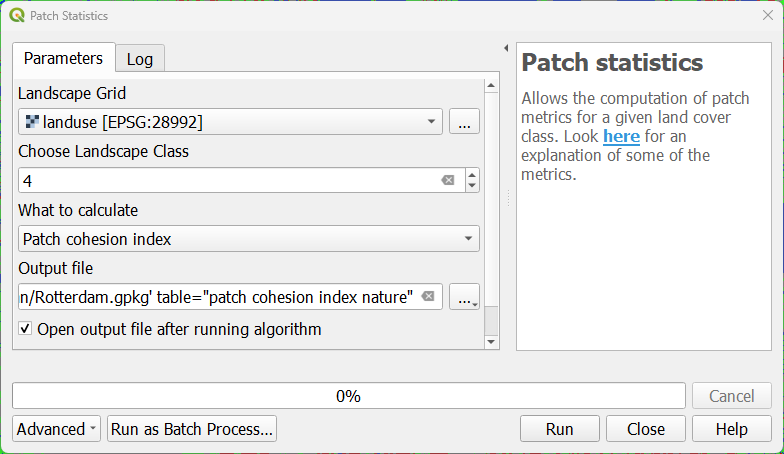
2. Make sure that landuse is chosen as Landscape Grid.
Type 4 at Choose Landscape Class.
Class 4 is Semi-natural.
We can calculate a lot of different metrics here.
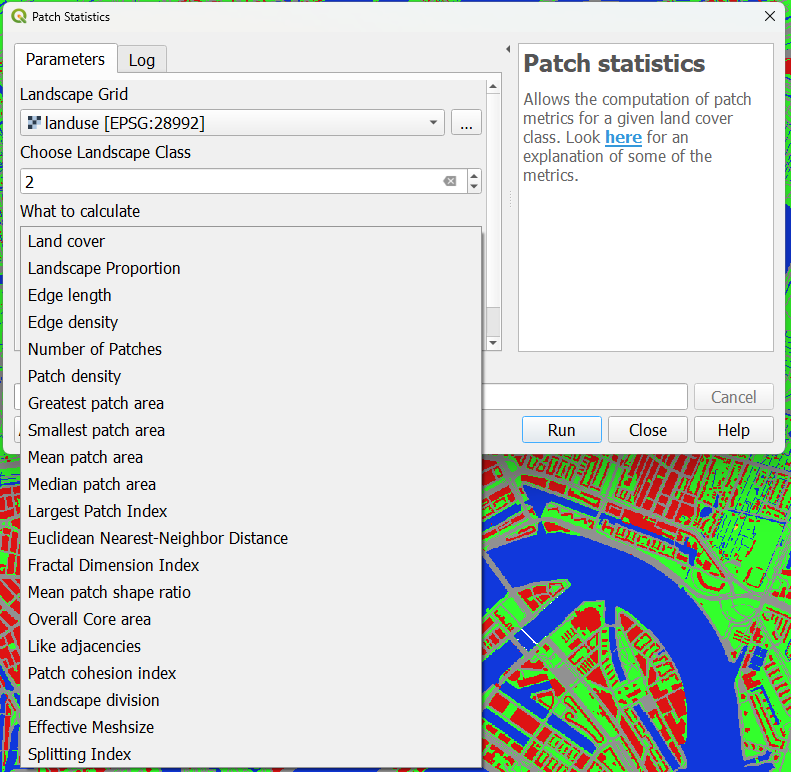
3. Choose Patch cohesion index.
The Patch cohesion index quantifies the physical connectedness of a specific patch type within a landscape. A higher value means that the patches of the class are more connected.
4. Save the output to your GeoPackage with the table name patch cohesion index nature.
5. Click Run. Click Close after processing is completed. This can take a while.
6. Open the attribute table of patch cohesion index nature and check the result.
This value doesn't say much, unless we compare it with another area or another land-use class.
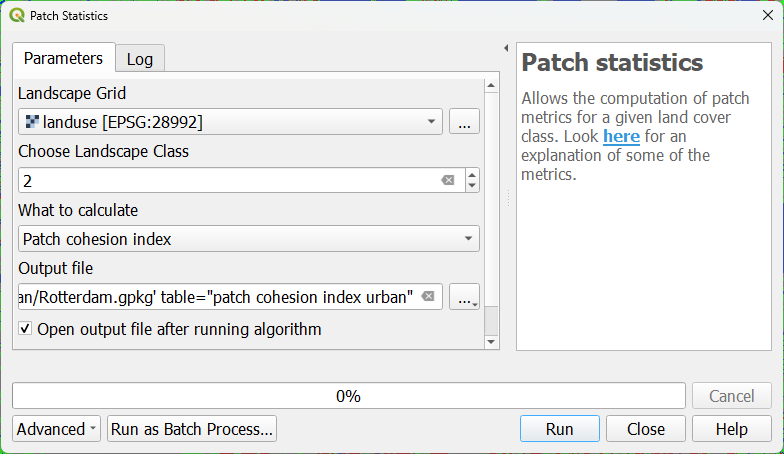
7. Repeat the calculation for the urban class by yourself. Call the result table patch cohesion index urban.
9. Repeat the steps to calculate the Patch cohesion index for Infrastructure.
You can try other patch-based metrics. Their descriptions can be found here.
This video shows the steps in this chapter: