Let's assume that we want to find patches that are close to water bodies. In this section, we'll create a proximity raster and use that for the selection of patches.
1. In the main menu, go to Raster | Analysis | Proximity (Raster Distance)....

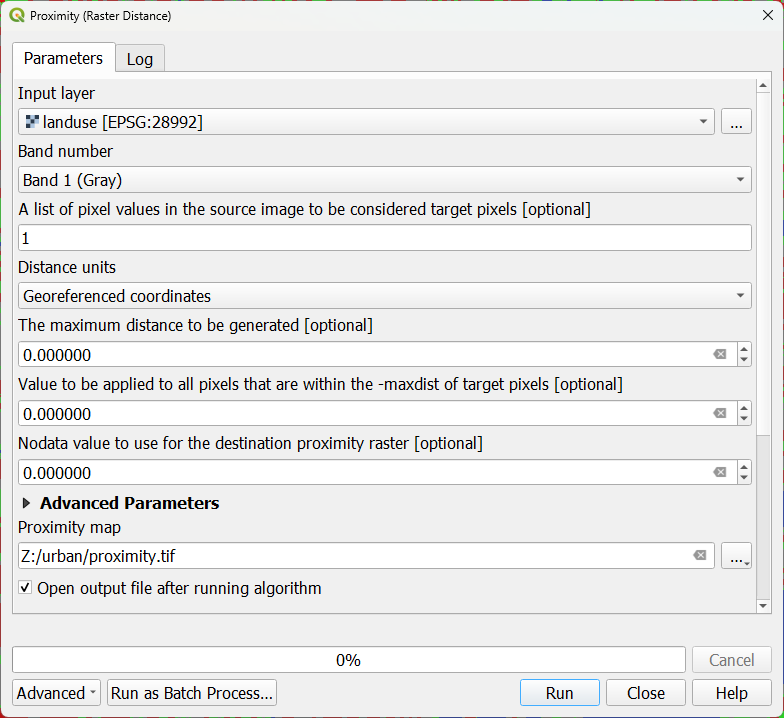
2. In the Proximity (Raster Distance) dialog, choose landuse as Input layer and type 1 at A list of pixel values in the source image to be considered target pixels. This is the Water bodies class.
3. Change Distance units to Georeferenced coordinates, so the result raster will have distances in meters.
4. Keep the rest as default and save the result as proximity.tif in your project folder.
5. Click Run. Click Close after processing.
6. Go to the Layer Styling panel and make sure the proximity raster is active. Choose Singelband pseudocolor as renderer and choose the Turbo colour ramp.

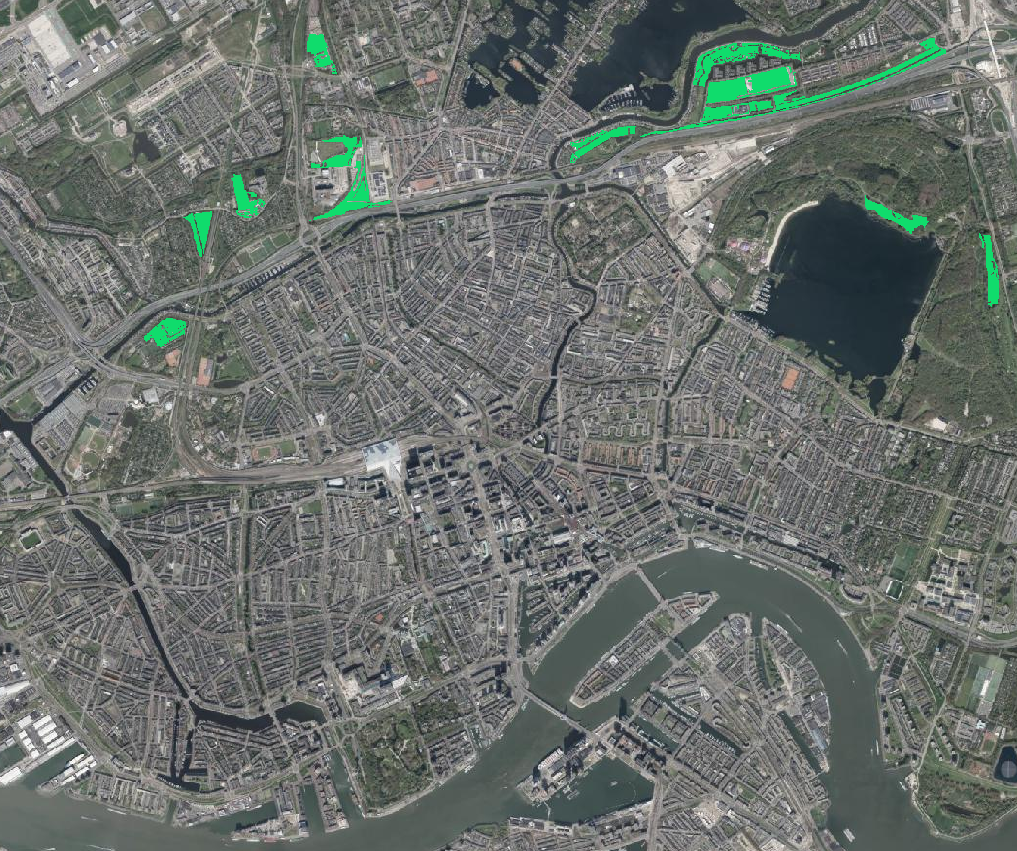
7. Move the patches layer to the top, so you can see which patches are closer and which are further from surface water.
Now we can use zonal statistics to derive the proximity statistics. Because we have two raster layers, we'll use the Raster layer zonal statistics tool.
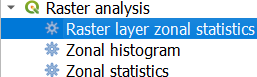
8. In the Processing Toolbox, go to Raster analysis | Raster layer zonal statistics.
9. In the Raster Layer Zonal Statistics dialog, choose proximity as the Input layer and patches as the Zones layer. Save the result to your GeoPackage with the name patch proximity.
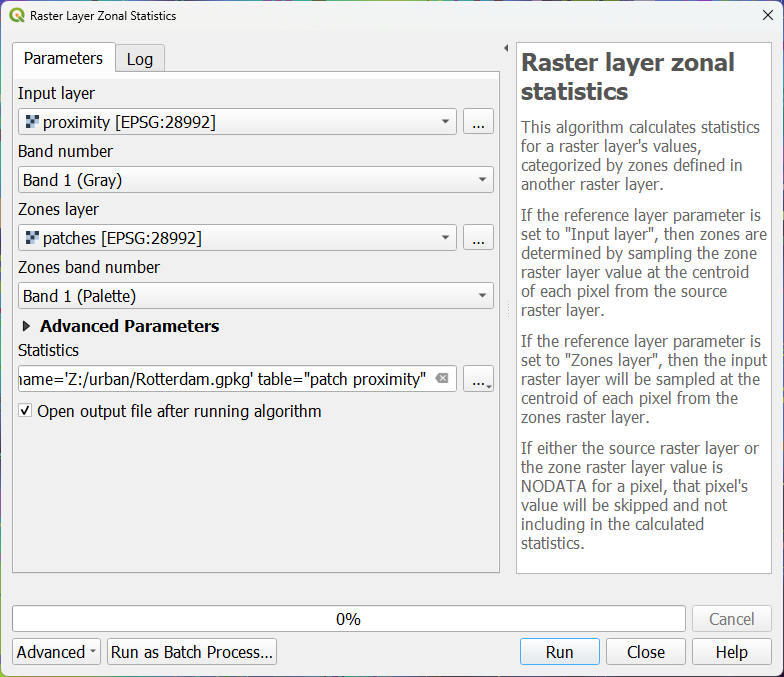
10. Click Run. Click Close after processing has finished.
11. Open the attribute table of patch proximity.
Now we can select the patches that are of a certain minimum size and maximum distance from surface water.
12. In the attribute table, click  to select features by using an expression.
13. Create the following expression:
"m2" > 25000 AND "max" < 100
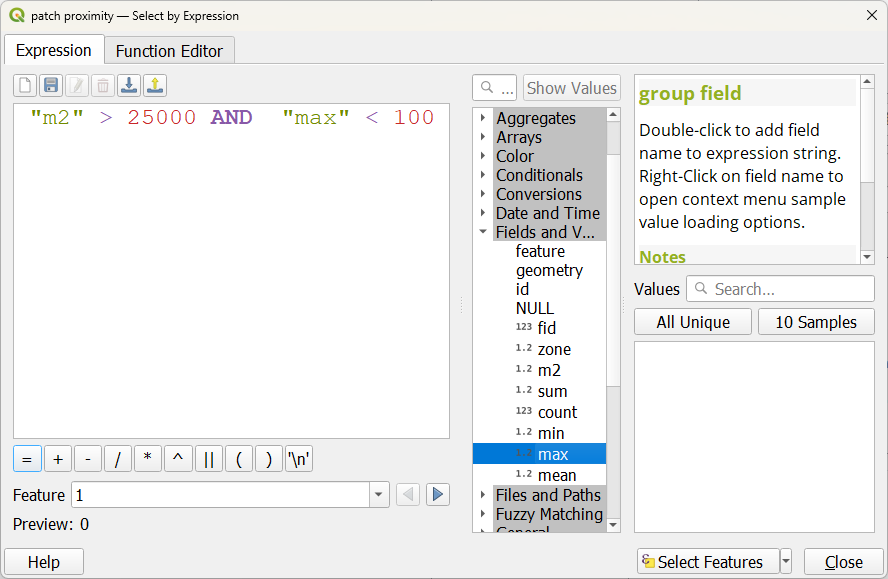
14. Click Select Features. Click Close.
The zone field shows the patch number.
Now we can make a new raster with only the selected patchs.
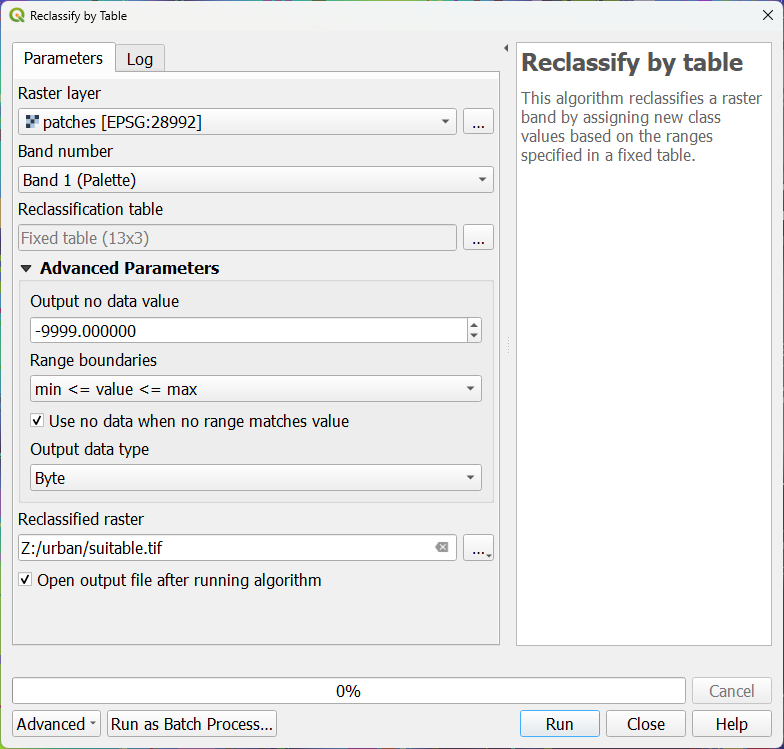
15. Use the Reclassify by table tool as we did in Section 3.2. Create a boolean raster with True for the selected features and False for the other features.
Hint: click at the bottom of the attribute table at Show All Features and change it to Show selected features.