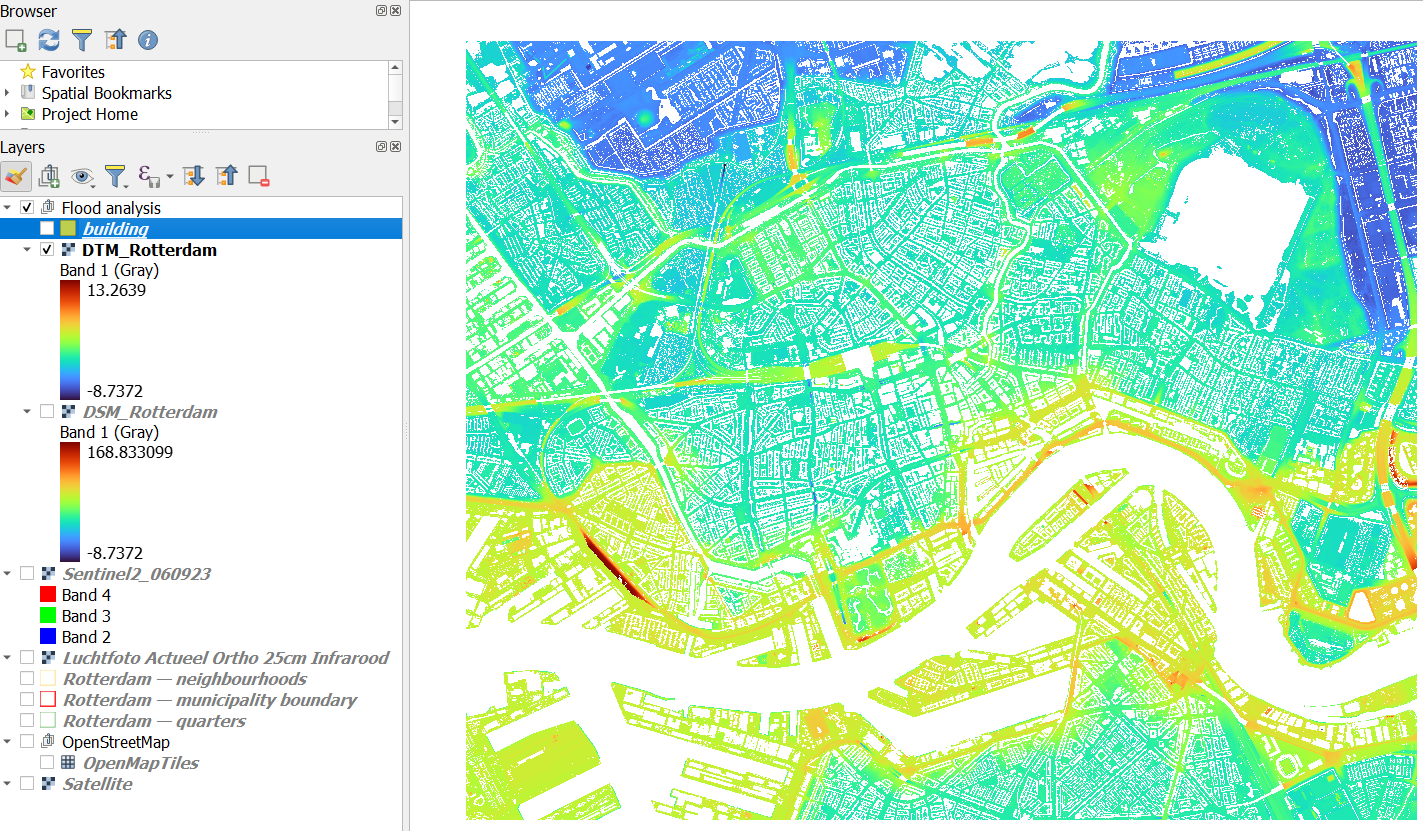
The DTM has all the objects, like buildings, filtered out of the raster. This results in voids: nodata pixels. To also get the terrain elevation of the locations of buildings, we'll interpolate the voids.
1. Make sure to make
DTM_Rotterdam visible by checking the box in the
Layers panel.
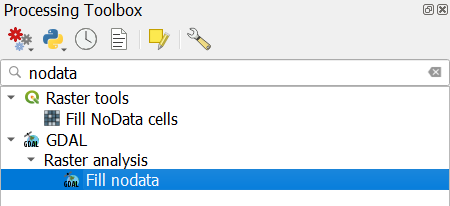
2. In the toolbar, click

to open the
Processing Toolbox panel.
3. In the processing toolbox, search
nodata.
4. Double-click on the
GDAL | Raster analysis | Fill nodata tool.
5. In the
Fill nodata dialog, choose for
Input layer DTM_Rotterdam. Only change the
Maximum distance (in pixels) to search out for values to interpolate to 100. 100 pixels of 0.5 m equals 50 meters, which should be enough to interpolate voids of buildings.
6. Call the output
Filled layer
DTM_voidsremoved.tif.
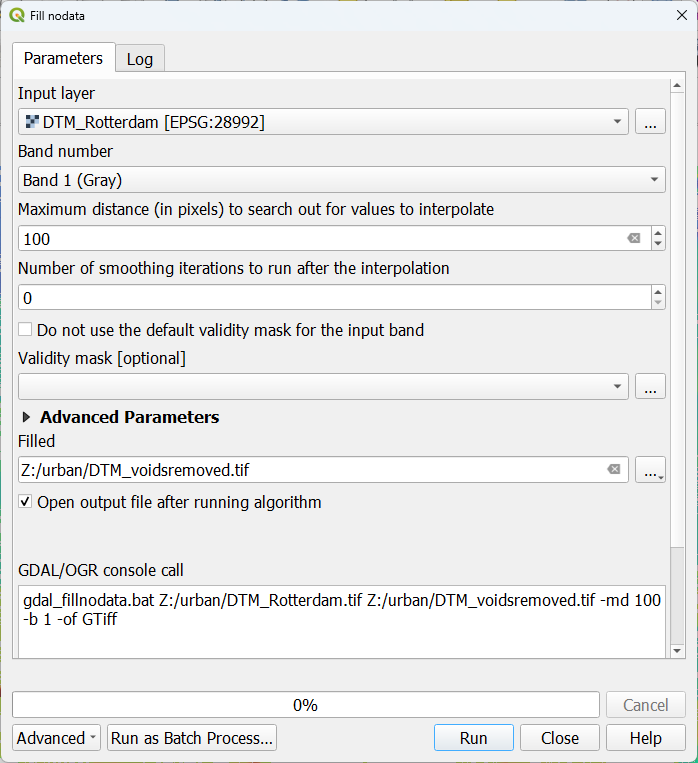
7. Click
Run. Click
Close when processing has finished.
8. Drag the
DTM_voidsremoved layer into the Flood analysis group and style the layer with the same colour ramp as the original layer.
9. Go to the histogram tab

.
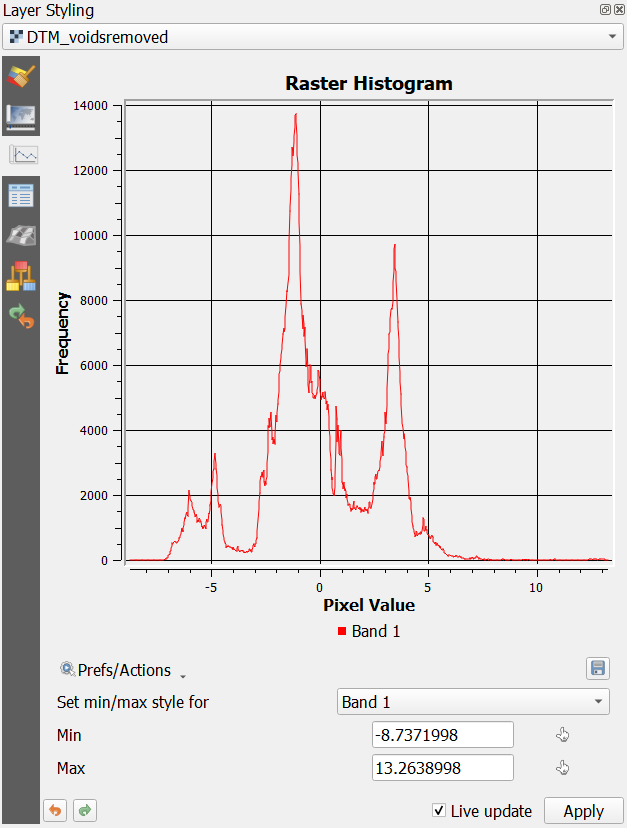
- What can you tell about the minimum and maximum elevations?
- Can you explain the peaks?
To better interpret this urban landscape, we're going to calculate the slopes.
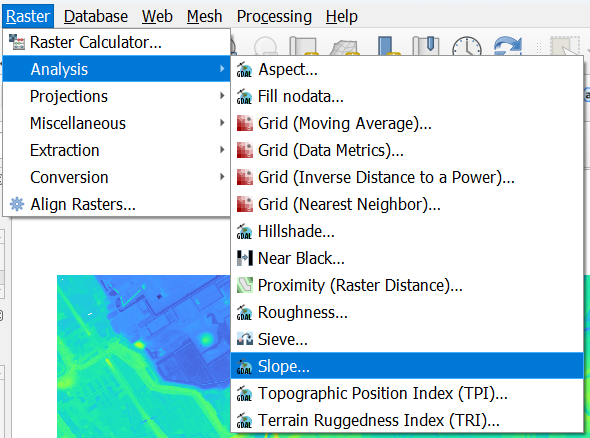
10. In the main menu, go to Raster | Analysis | Slope....
11. In the Slope dialog, make sure the DTM_voidsremoved layer is chosen as the Input layer. Keep the rest as default and save the result to slope.tif in the folder of your GeoPackage.
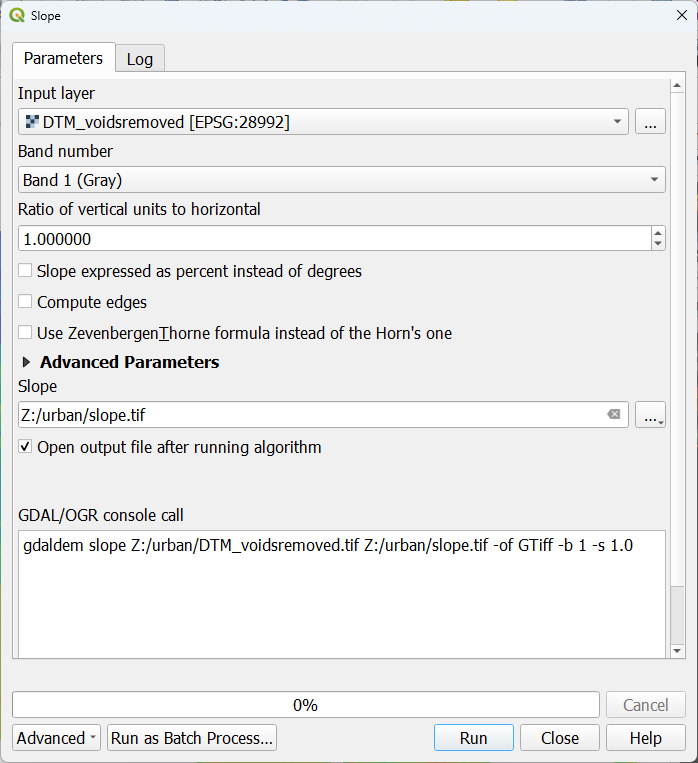
12. Click Run. Click Close when processing is completed.
13. Drag the slope layer into the Flood analysis group and style the layer with a ramp.
14. Check the histogram.
- What do you observe?
- What are most of the steep slopes in this city?
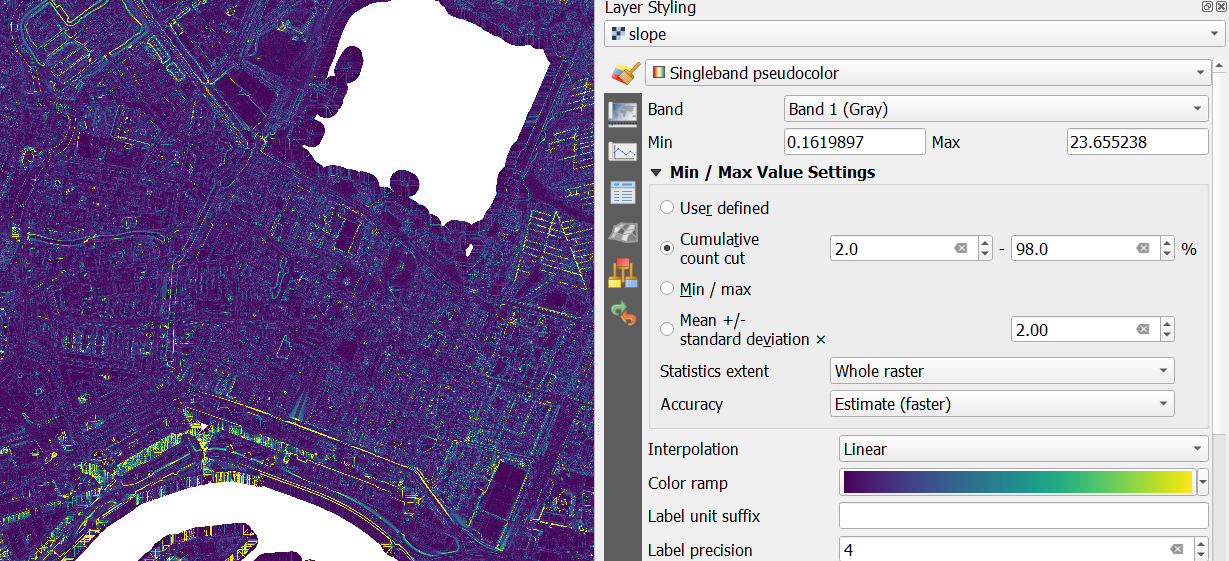
15. Because many pixels have a low slope and few have a high slope, you can best change the Min / Max Value Settings to Cumulative count cut, to see more details
Now you can clearly see the dykes and highway ramps.
Next, we're going to work on the building heights.