
Flood analysis with GIS
3. Prepare flood extent layers
In this chapter, we're going to prepare the flood extent layers. We'll use the DTM and the QGIS Raster Calculator.
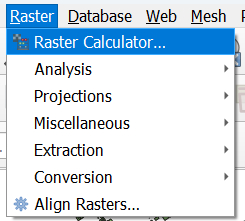
1. In the main menu, go to Raster | Raster Calculator....
In the Raster Calculator, you can see all raster layers under Raster Bands. The @# shows the band number. Our DTM and DSM layers are singleband raster layers, so they all show @1. For the Sentinel2 you can see that the different bands are showns (@1, @2, etc.).
2. At Raster Bands, double-click on DTM_voidsremoved@1 to add it to the Raster Calculator Expression. Then click <= and type 1.
In this way you have composed the expression:
"DTM_voidsremoved@1" <= 1
which means that all pixels of DTM_voidsremoved that have a value less than or equal to one will result in boolean true (one) and other pixels will have boolean false (zero).
3. Under Result Layer use  to browse to your project folder and save the result to flood1m.tif.

4. Keep the rest as default and click OK.
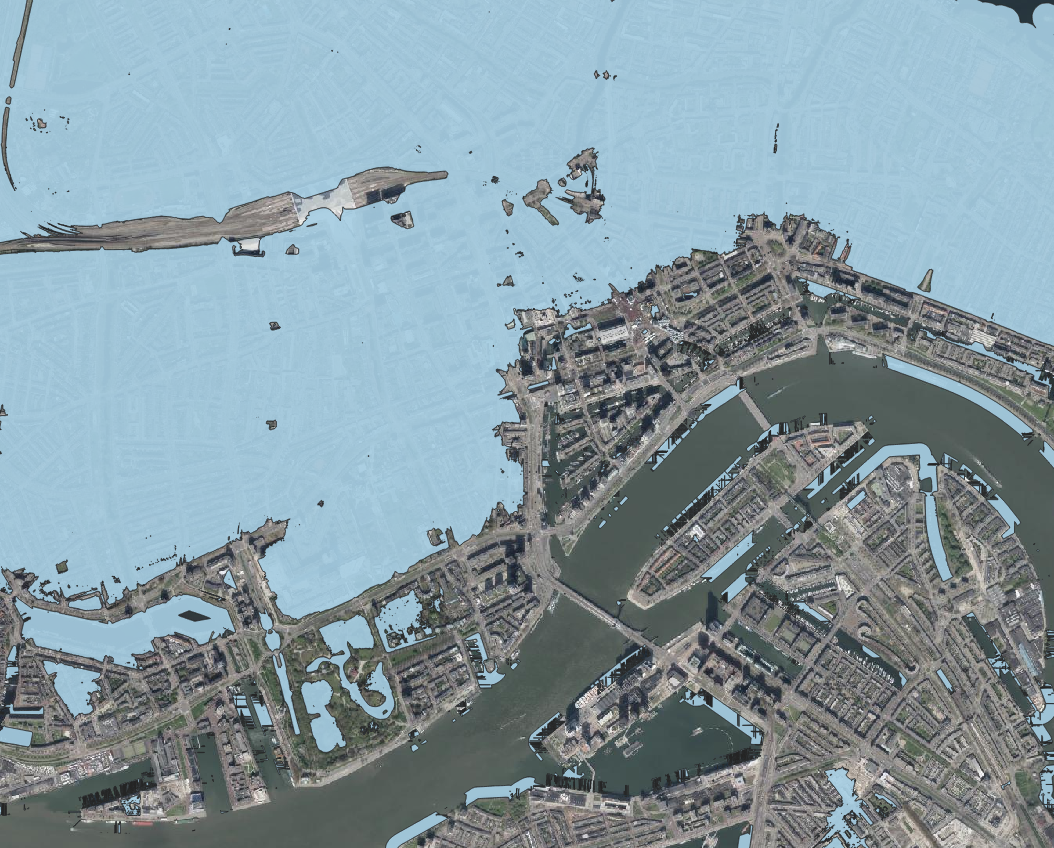
5. Visualize the result. For boolean rasters we use the Paletted/Unique values renderer. Remove the zeros, so they're transparent. Make the ones blue, so we can clearly see the flood extent over our other layers.
It's nicer to visualise the flood extent as a vector layer. Let's convert the raster to vector.
6. In the main menu, go to Raster | Conversions | Polygonize (Raster to Vector)....

7. In the Polygonize dialog, choose flood1m as the Input layer. Keep the rest as default and save the result as a shapefile with the name flood1m.shp.
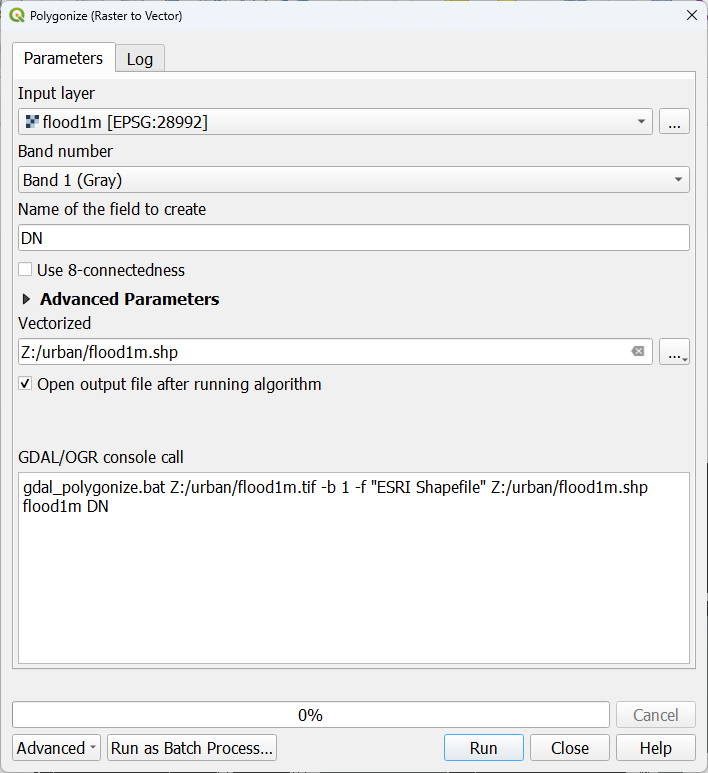
8. Click Run. Click Close after processing has completed.
As you can see, the polygon has both the flooded and not flooded areas. Let's remove the latter.
9. In the Layers panel, go to the attribute table of the flood1m vector layer.
10. Click  to select features with an expression.
11. In the Select by Expression dialog, go to the middle panel, expand Fields and Values and double-click on the DN field to add it to the expression. Then click  and type 1.
Now your expression should look like this:
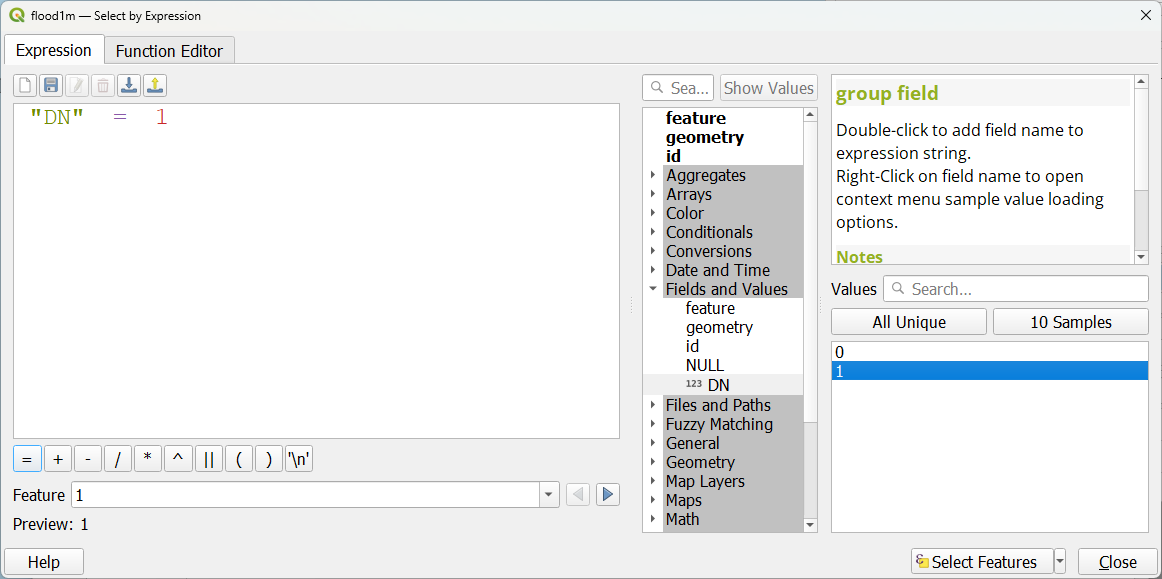
12. Click Select Features and click Close to close the dialog.
In fact we want to delete the zeros, so we need to invert the selection (or go back and choose "DN" = 0).
13. Click  to invert the selection.
Now all the features with value 0 for DN are selected.
14. Click  to toggle to editing mode.
15. Click  to delete these features.
16. Click again to toggle off editing mode and confirm that you want to save the changes.
17. Style the polygons with a light blue colour and some transparency.

17. Now repeat this for different flood levels: 0.5, 1.5, 2 m.