
In this section, we're going to evaluate how temperature and green space vary between different neighbourhoods.
We'll use zonal statistics.
1. In the Processing Toolbox, go to Raster analysis | Zonal statistics.
2. In the Zonal Statistics dialog, choose neighbourhoods as Input layer and NDVI_060923 as Raster layer.
3. Change the Output column prefix to NDVI_. Later we'll add the temperatures, so in this way we can easily distinguish the fields.
4. For Statistics to calculate, choose Mean, St dev, Minimum and Maximum.
5. Save the result to the GeoPackage with the name NDVI per neighbourhood.

6. Click Run. Click Close after processing.
7. Check the attribute table.
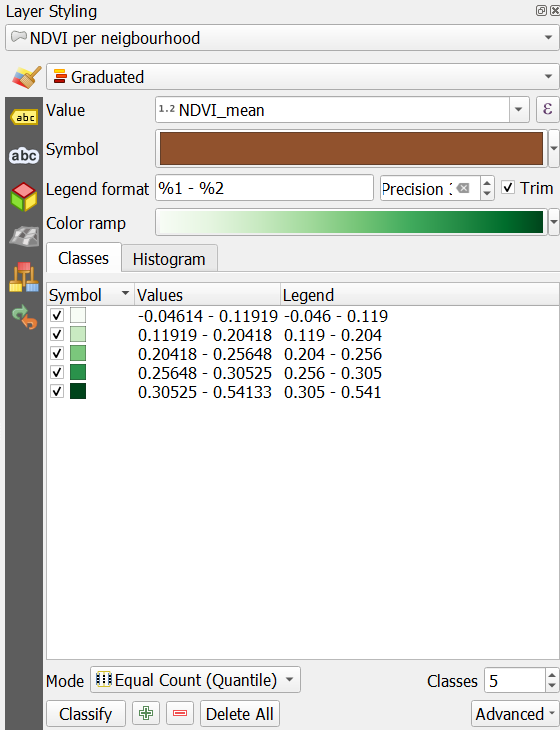
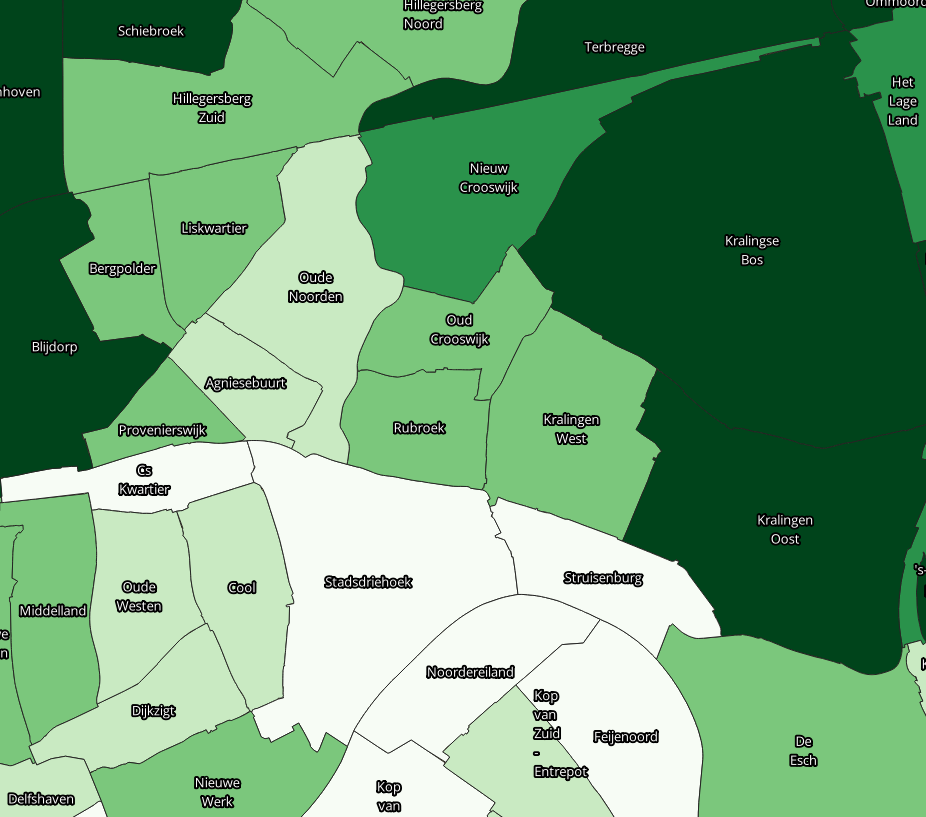
8. Style the NDVI per neighbourhood with the Graduated renderer. Use the NDVI_mean field and a green colour ramp.
9. Add labels with buurtnaam as we did before.
10. Repeat the zonal statistics calculation for the T_Celsius_09092023 layer. Add the statistics to the NDVI per neighbourhood attributes.
If you get the error that there's a problem with the geometries, you need to fix them. Go to the Processing Toolbox. Click  to activate in-place editing and apply the Fix geometries tool. Save the edits and unselect the features. Then try again to run the Zonal statistics tool.
11. Style the polygons and label them in the same way.
12. Compare the results of temperatures and NDVI per neighbourhood.

This video shows more about zonal statistics: