
A very common index for healthy vegetation is the Normalized Difference Vegetation Index (NDVI).
This is the equation:
where NIR is the Near Infrared Band and Red is the Red band of a remote sensing sensor.
Values that are positive indicate healthy vegetation. The higher the value the more green biomass is present. Negative values indicate water bodies.
Here we'll derive NDVI from the Sentinel image. We'll use the Raster Calculator.
1. In the main menu, go to Raster | Raster Calculator....
2. Compose the the equation above as an expression. Band 4 is the NIR band and band 3 is the red band.

3. Save the result as NDVI_060923.tif.
4. Click OK.
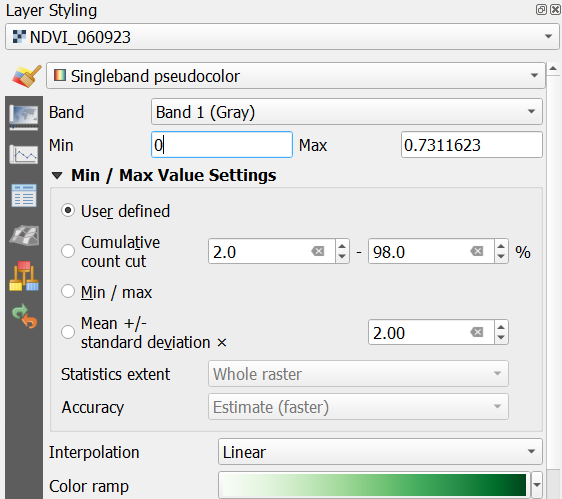
5. Go to the Layer Styling panel and make sure NDVI_060923 is the active layer.
6. Change the renderer to Singleband pseudocolor.
7. Choose a green ramp and change the minimum value to 0 to have better contrast.
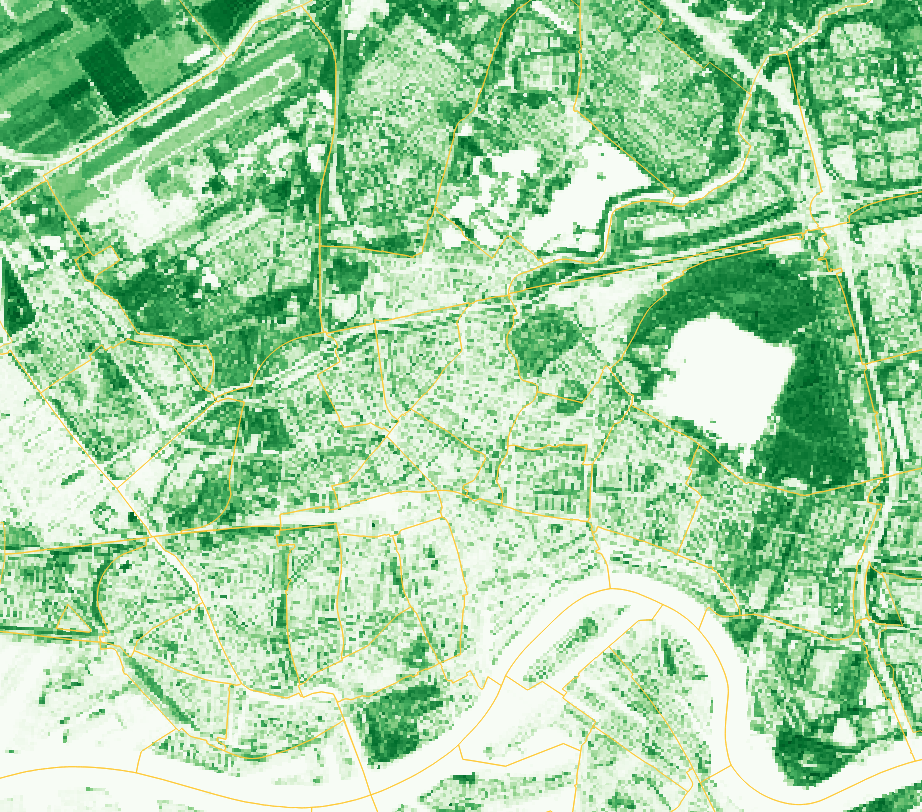
This image gives us a good overview of healthy green vegetation in the city.
In the next section, we'll evaluate how this varies per neighbourhood.
